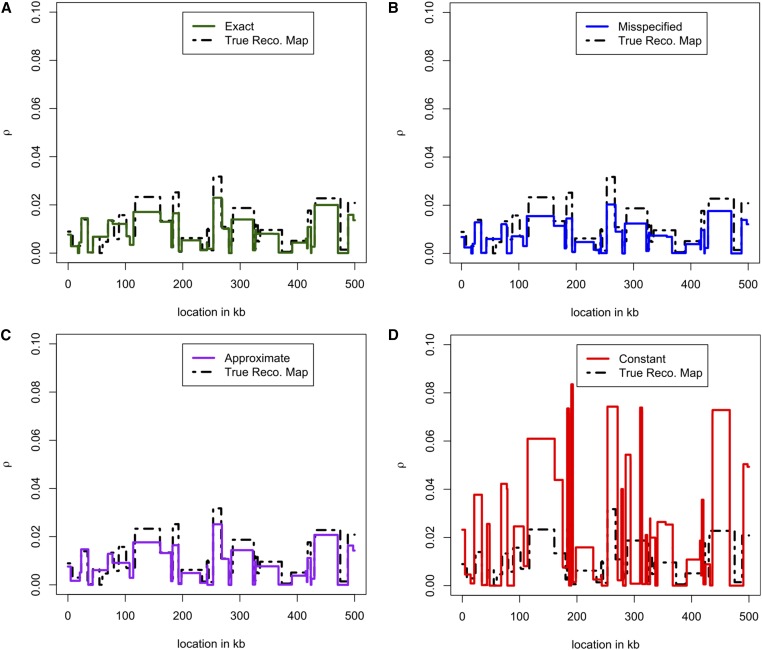
Figure 5.
Comparison of recombination maps inferred using different lookup tables. We simulated haplotypes under the three-epoch model (6) and using the recombination map shown as a black dashed line. (A) Inferred map obtained using the exact likelihoods for the true demography. (B) Inferred map obtained using the empirically estimated demography in (8). (C) Inferred map obtained using an approximate lookup table for the true demography. (D) Inferred map obtained assuming a constant population size of Note that is much noisier than the other estimates, while using an inferred demography or an approximate lookup table results in only a very mild reduction in accuracy compared to using the true sampling probabilities. These were produced with LDhelmet; using LDhat led to very similar results.

