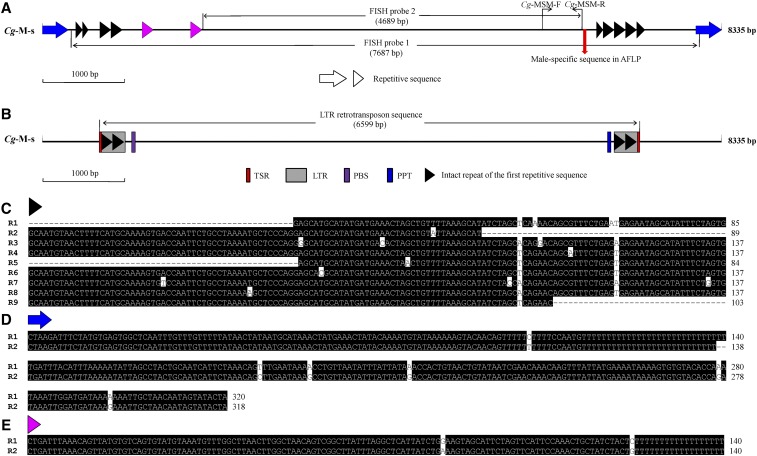
Figure 5.
Repetitive sequence analysis in the male-specific sequence (Cg-M-s). (A) Schematic diagram of repetitive sequences in the male-specific sequence (Cg-M-s). Arrows and arrowheads with the same color indicate repetitive sequences of similar sequences. The sites of primers including Cg-MSM-F and Cg-MSM-R are marked by black arrows. The FISH probes are marked by black line arrows. The red arrow shows the position of the male-specific sequence found in the AFLP analysis. (B) Schematic diagram of the predicted LTR retrotransposon sequence revealed by LTR_FINDER. Red boxes indicate TSR. Gray boxes indicate LTR. Purple boxes indicate primer binding sites. Blue boxes indicate the PPT. The positions and sequences of the above elements are given in Table S2. (C–E) The alignment of repetitive sequences is indicated by arrowheads or arrows with the same color. The similar repetitive sequences are numbered from left to the right as shown in (A). Cg, C. gibelio; R, repetitive sequence.

