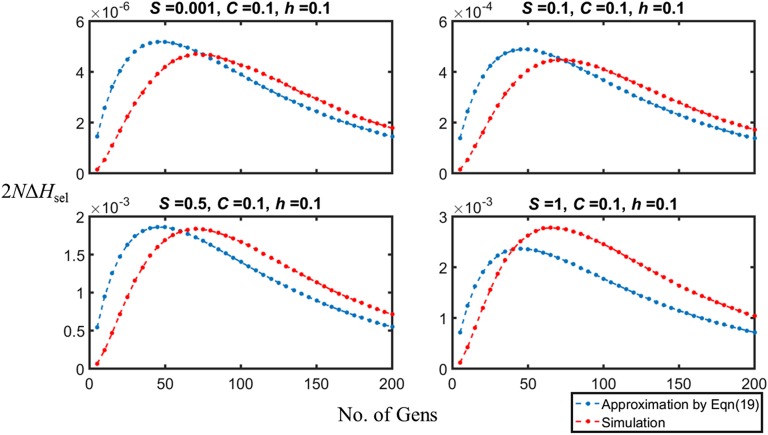
Figure 4.
A comparison of the values of 2N ΔHsel obtained from the simulations and from Equation 19 (using values of Y7 = E{D2} obtained from the simulations), with C = 0.1, q* = 0.3, and N = 50. The initial frequency of A1 was 0.5. The panels display the approximate results from Equation 19 (blue solid circles) and the simulation results (red solid circles), for different values of S. The confidence intervals are too small to be easily seen.

