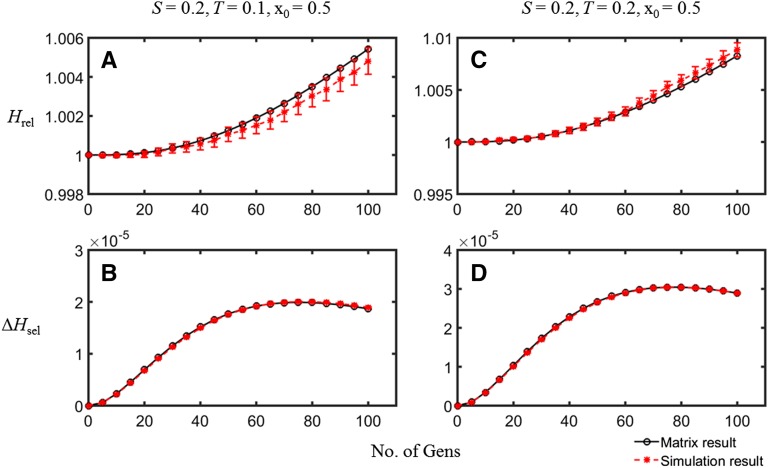
Figure 5.
A comparison of the simulation results (red symbols, with 95% confidence interval error bars) with the matrix approximation (black open circles) for the case of heterozygote advantage. A and B plot Hrel and ΔHsel against time for scaled selection coefficients S = 0.2 and T = 0.1; C and D give the values of these variables when S = 0.2 and T = 0.2. N = 50, C = 0.1, and the initial frequency of A1 was 0.5.

