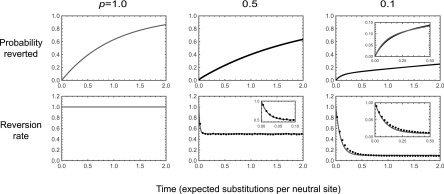
Figure 2.
Dynamics of reversion for a biallelic fitness landscape with 100 sites other than the focal site, where each genotype is viable with probability p, all viable genotypes are neutral relative to each other, and each site experiences forward and backward mutations at rate 1. The top row shows the probability that a population has reverted as a function of time, and the bottom row shows the reversion rate. Theoretical results are shaded lines, and simulations are solid lines. Solid circles in the bottom row calculate the reversion rate in terms of temporal bins of width 0.05, where the reversion rate in a bin is calculated as the number of simulations that revert during that bin divided by the average of the number of simulations that have not yet reverted at the beginning of that bin and the number of simulations that have not yet reverted at the end of that bin. Insets show details of dynamics at short times. Simulation results are based on 1,000,000 runs for each value of p.

