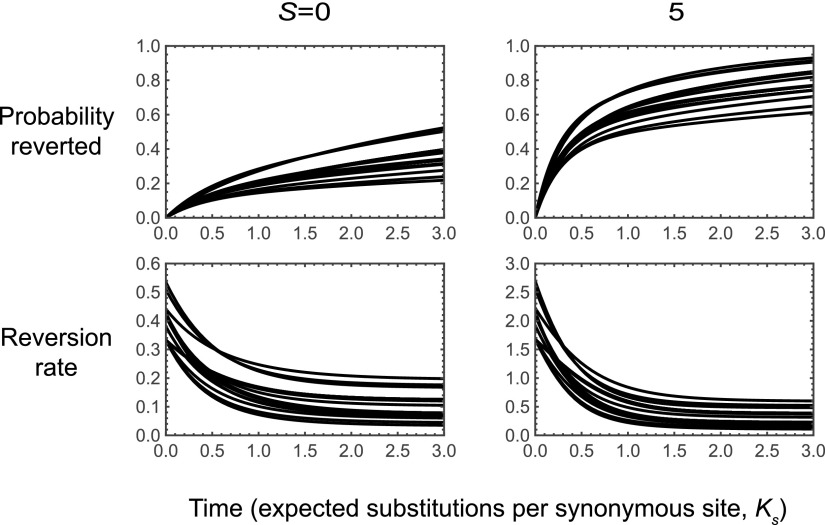
Figure 3.
Dynamics of reversion for a codon model where the focal amino acid has scaled selection coefficient S over all other amino acids and mutations occur at rate 1 at each site with an equal probability of producing each of the alternative nucleotides. The top row shows the probability of having reverted by time t and the bottom row shows the reversion rate, where each of the 20 curves corresponds to a different choice of one of the 20 amino acids as the focal amino acid. Under moderate selection for the focal amino acid (), the time evolution of the fraction of populations that have already reverted shows a pronounced knee.

