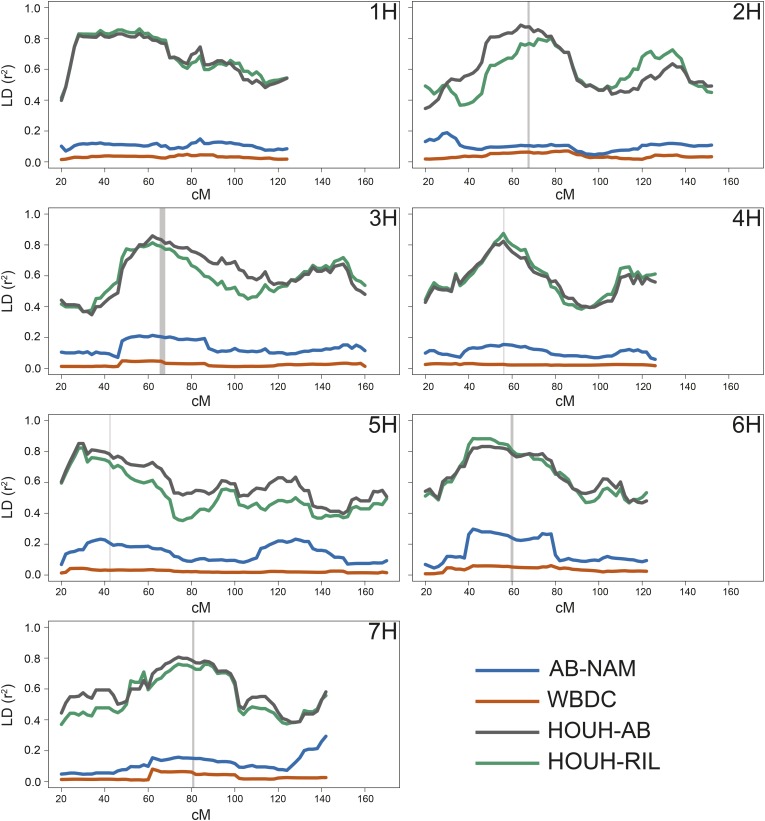
Figure 3.
Genome-wide pair-wise LD in wild barley mapping populations. Average pairwise LD (r2) calculated for all segregating BOPA1 markers in 40-cM interval moving windows, with windows calculated every 2 cM across each chromosome 1H–7H in the wild barley AB-NAM population, the WBDC association mapping panel, the OUH-602 × Harrington Advanced Backcross (HOUH-AB) mapping population, and the OUH-602 × Harrington Recombinant Inbred Line (HOUH-RIL) mapping population. Pericentromeric regions as identified in Muñoz-Amatriaín et al. (2011) are denoted by vertical gray bars.

