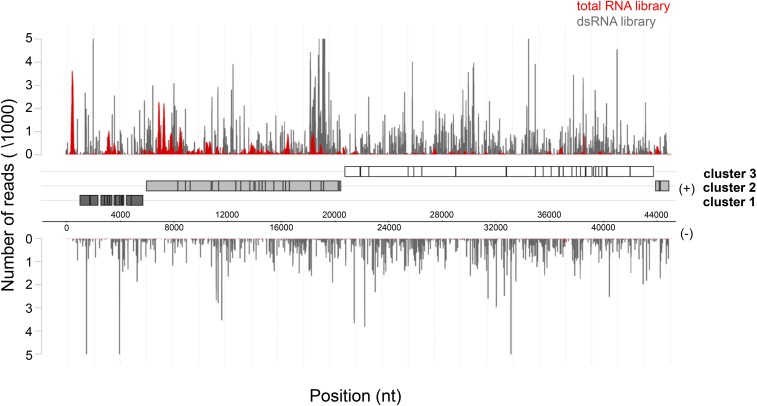
Figure 1.
In vivo phage dsRNA formation. Distribution of reads mapped to the sense (+) and antisense (−) strand of the P-SSP7 genome originating from total RNA (red plot) or enriched dsRNA (gray plot) after 4 hr of MED4 infection, respectively. Dark-gray, light-gray, and white boxes denote annotated genes located in expression clusters 1, 2, and 3, respectively. Genomic coordinates are given in bases on the x-axis. The number of reads is given on the y-axis.

