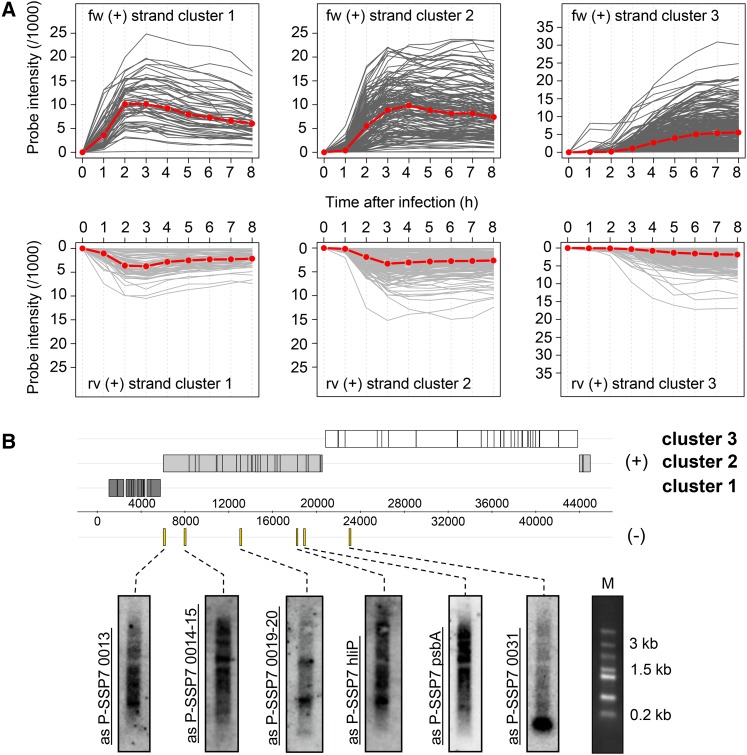
Figure 3.
Expression of phage genes and asRNAs during infection of MED4. (A) Temporal expression patterns for the coding and noncoding strand of each P-SSP7 ORF as determined from microarrays (Lindell et al. 2007). Microarrays were reanalyzed at single probe resolution and plotted for each expression cluster at indicated time points (x-axis). The red line specifies the median signal intensity. (B) Northern blot analysis showing expression of six P-SSP7 asRNAs 4 hr after infection. All but the 0031 gene had asRNAs >3 kb. Probed regions on the genome are marked with yellow bars. M denotes Fermentas high-range marker. The genome map is the same as in Figure 1.

