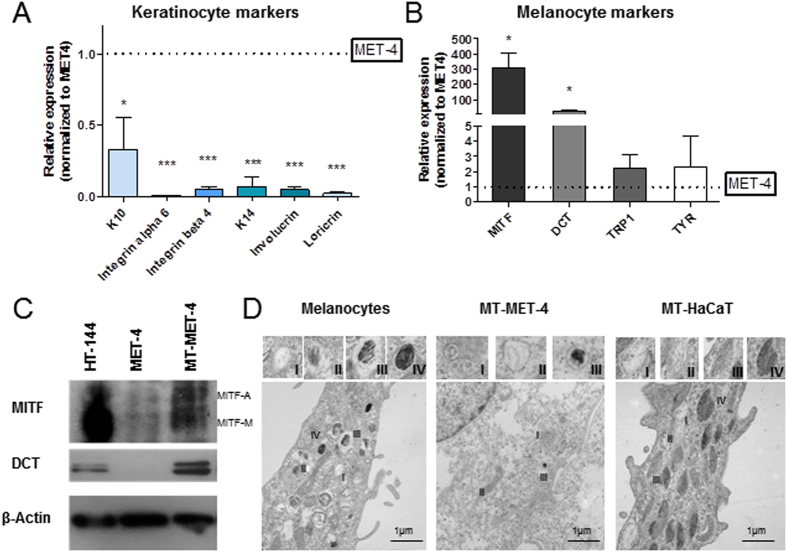
Figure 2. Melanocyte characteristics in MT-MET-4 cells and MT-HaCaT cells.
(A) Expression of keratinocyte markers and (B) melanocyte markers in transdifferentiated MT-MET-4 cells compared to MET-4 cells. Several keratinocyte markers were downregulated in the MT-MET-4 cells relative to the MET-4 cells. Error bars show SD of three independent experiments. P values were calculated by two-tailed, unpaired sample t-test (*p < 0.05, **p < 0.01, ***p < 0.005). (C) Western Blot analysis of the expression of the melanocyte markers MITF and DCT. (D) Electron microscope pictures showing stage I to IV of melanosomes in human melanocytes. Melanosomes in stage I-III were present in MT-MET-4 cells. Transdifferentiated HaCaT cells contained high amount of melanosomes from all four stages.

