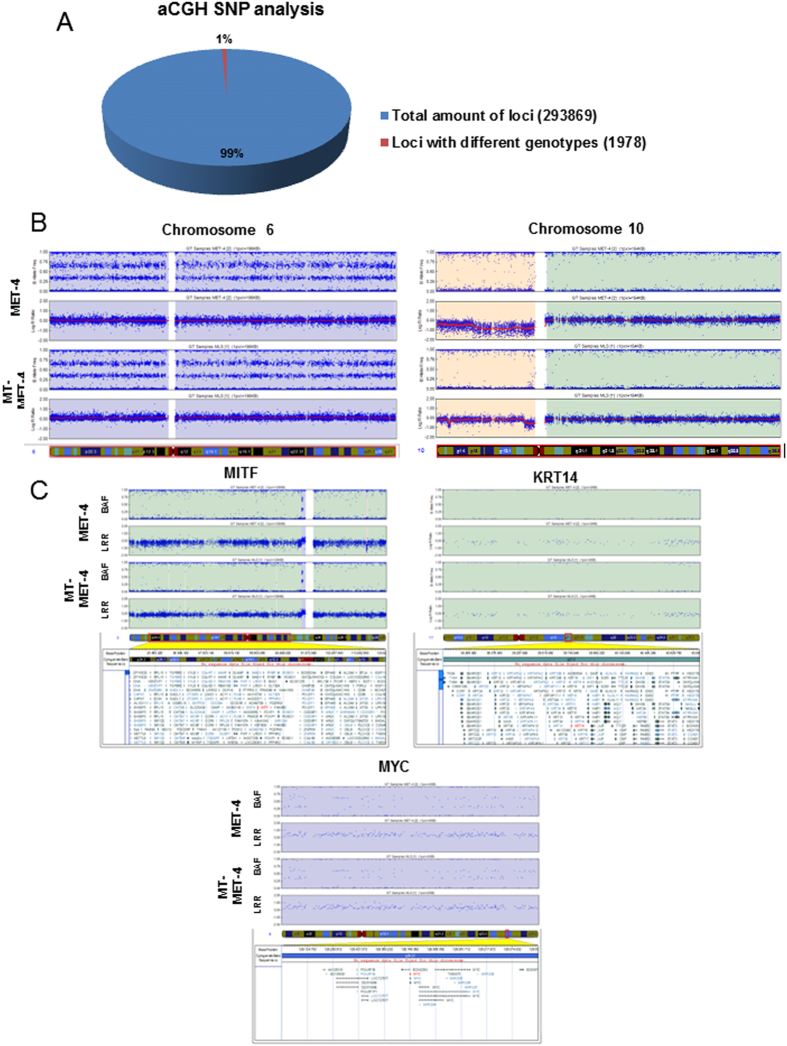
Figure 3. Analysis of chromosomal abberations.
(A) aCGH SNP analysis. The genotypes of 293869 loci in MET-4 and MT-MET-4 were compared. The same genotype was identified for 99% of the loci analysed. (B) Most of the genomic regions in MET-4 and MT-MET-4 were present in the same copy number. Chromosome 6 and 10 are shown representatively. (C) The copy number variation has been compared for several genes of interest. No variation was present in melanocyte-specific genes, keratinocyte-specific genes or tumor suppressors and oncogenes. Shown here representatively are MITF, KRT14, and MYC.

