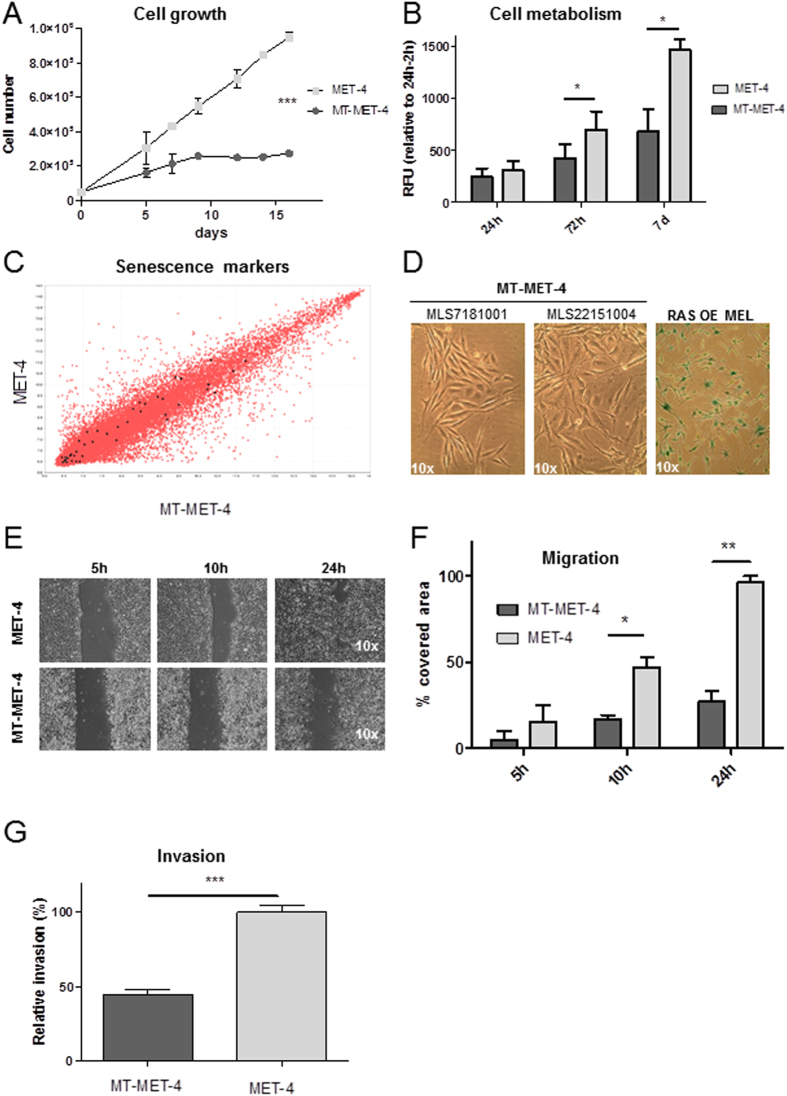
Figure 5. Analysis of transdifferentiated MT-MET-4 cells.
(A) Cell growth curve. Error bars depict the SD of three independent experiments. P values were calculated by two-way ANOVA (***p < 0.005). (B) Cell metabolism analysis. The metabolic activity of MET-4 and MT-MET-4 cells was measured 24 h, 72 h and 7d after seeding. (C) Comparison of senescence marker expression in MET-4 cells and MT-MET-4 cells. (D) β-galactosidase staining of two different batches of MT-MET-4 cells (MLS7181001 and MLS22151004) and RAS-overexpressing normal human melanocytes (RAS OE MEL). In comparison to the melanocytes, the MT-MET-4 cells are negative for the senescence marker β-galactosidase. (E) Migration assay. The migration capacity of MET-4 cells and MT-MET-4 cells was observed over 24 h. (F) Quantification of the migration potential. For analysis the software t-scratch was used which calculated the % of free area. (G) Invasion assay. MT-MET-4 cells are less invasive compared to the parental MET-4 cells.

