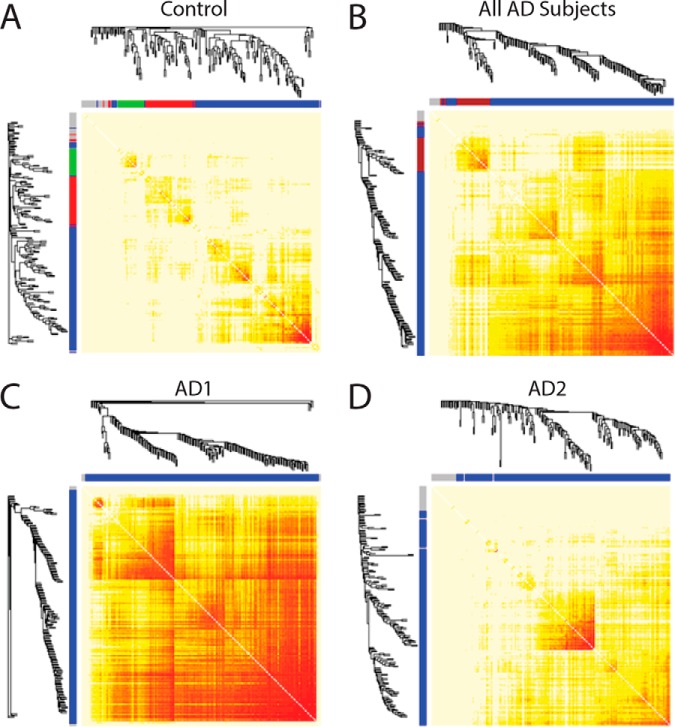
Fig. 2.
Protein network co-expression heatmaps. Protein coexpression is shown for control subjects in (A) and all AD subjects in (B). Greater correlation between proteins is shown as intensity depth of red color. Clustering of proteins into multiple modules is evident in the controls subjects, as indicated by the dendrograms and corresponding X and Y axis color coding of the individual modules. The increase in coexpression in AD is evident. These effects are due largely to the AD1 but not the AD2, subgroup (C and D).

