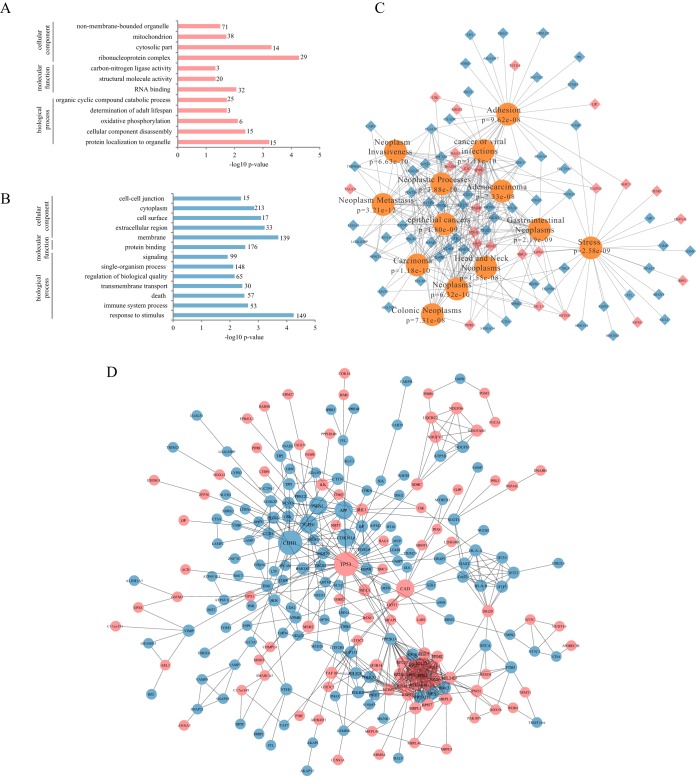
Fig. 3.
Bioinformatic analysis of differentially expressed proteins upon UHRF2 overexpression. A, Gene Ontology (GO) enrichment analysis for biological process, cell component and molecular function of up-regulated proteins. The -log10 p value of enrichment is shown on x axis; the numbers represent the number of associated proteins for each term. B, GO enrichment analysis of down-regulated proteins. C, Diseases associated with UHRF2-altered proteins were shown according to the enrichment analysis in WebGestalt. D, Network of proteins regulated by UHRF2. Two hubs of p53 and CDH1 were shown. Red nodes represent increased proteins and blue nodes represent decreased ones; nodes of more than ten interacting neighbors were drawn in large size; and nodes with 5–10 neighbors were in median size.

