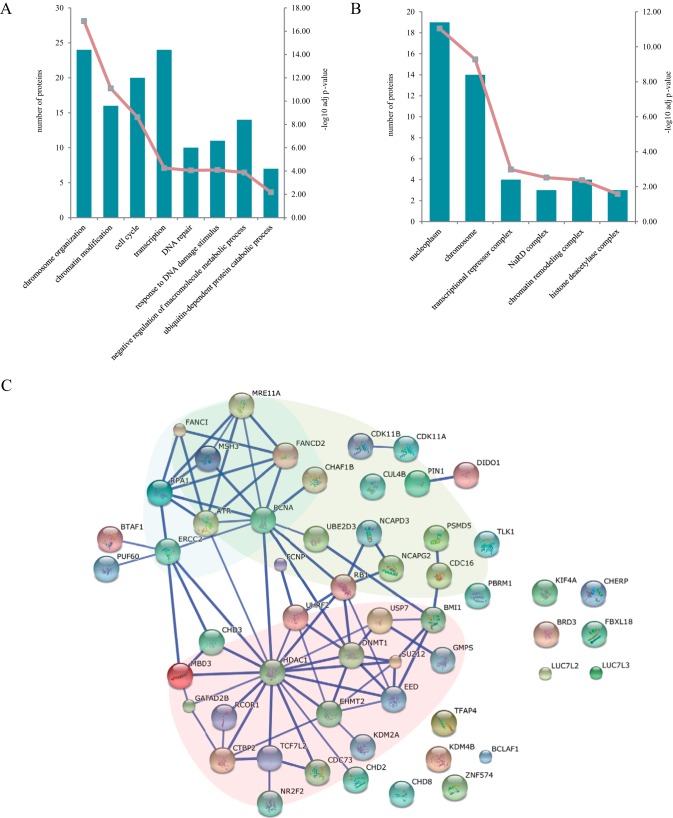
Fig. 7.
Analysis of the UHRF2 interactome. A, GO enrichment analysis of UHRF2 interactors for biological process. The bar plot represents the proteins involved in each term and the numbers are displayed in left y axis. The -log10 p value of each function class are shown using line plot in right y axis. B, Cellular Component analysis of interactome. C, Protein interaction network of 54 UHRF2 interacting proteins were analyzed with STRING database. Three subnetworks which mainly enriched in chromatin/histone modifications, cell cycle and DNA repair are indicated by red, green and blue background respectively. Interactions shown have high confidence cutoff score of 0.7.

