
Fig. 4.
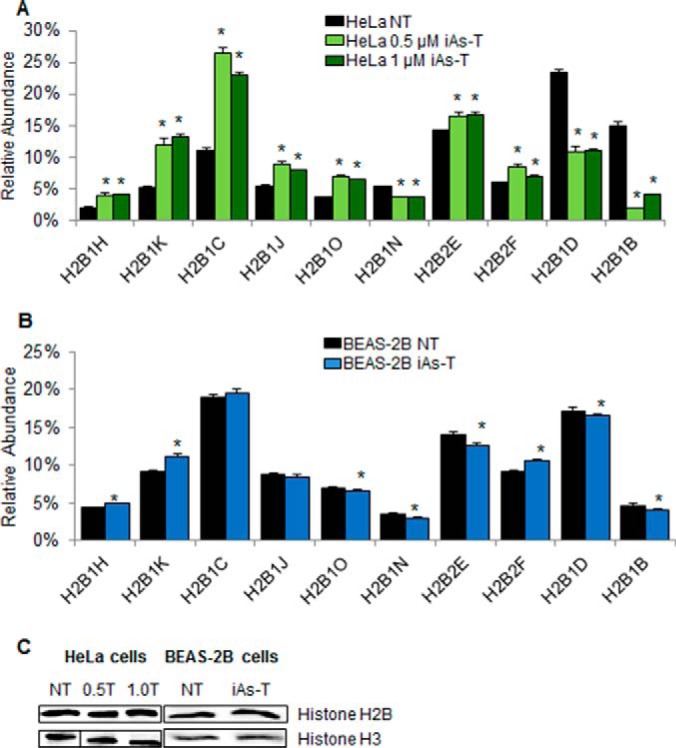
Mass spectrometry profiling of H2B variants in NT and iAs-T cells. A, Profiles of H2B variants in HeLa cells show differential abundance of 10 histone H2B variants in iAs-transformed cells compared with time-matched NT cells, after 16 days of treatment. Additionally, there were no major changes in the expression levels in cells transformed with 0.5 μm and 1 μm iAs. B, Changes in the abundance of these variants were confirmed in BEAS-2B cells. Although most of the variants show patterns similar to iAs-T HeLa cells, H2B1J, H2B1O, and H2B2E, show different patterns of expression in the iAs-T BEAS-2B cells. C, Western blots of total histones H2AB and H3 show equal expression in treated and nontreated cells. Equal amounts of nuclear protein (25 ng) were loaded onto a 15% SDS-PAGE gel and blotted for H2B or H3. Error bars represent standard deviation from three technical replicates. Biological replicates in HeLa and BEAS-2B cells show a similar trend (supplemental Fig. 7). Asterisks denote p values < 0.05 as determined by Student's t test.