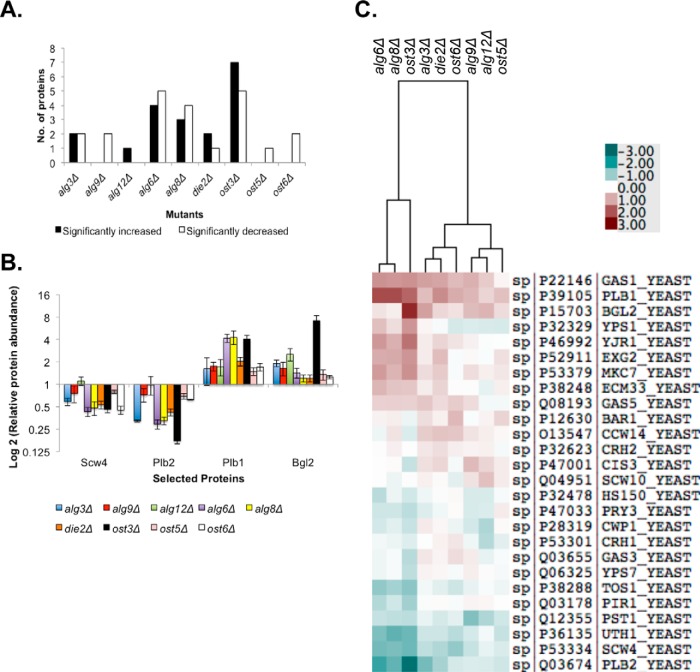
Fig. 4.
Hypoglycosylation causes major alterations in the cell wall proteome. A, Number of cell wall proteins that show a significant increase (black) or decrease (white) in abundance in each mutant strain compared with wild-type, as measured by SWATH-MS. B, Change in abundance of selected cell wall proteins in each strain relative to wild-type. Data is mean ± S.E. of biological triplicates. C, Clustered heatmap showing changes in abundance of cell wall proteins in each strain relative to wild-type. Each square represents the mean of biological triplicates. The data was clustered with Cluster 3.0 and presented using TreeView. Data from supplemental Table S4.

