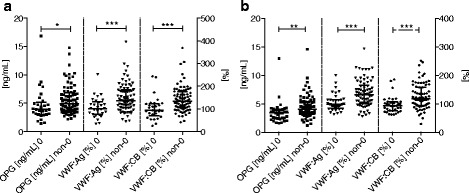
Fig. 2.

Plasma OPG, VWF: Ag levels and VWF:CB activity in patients and controls. Column scatter plot graph of the OPG and VWF values in patients (a) and controls (b) according to 0 and non-0 blood groups. Values represented as median with interquartile range. Significant differences marked with * for p < 0.05, ** p < 0.01, *** p < 0.001
