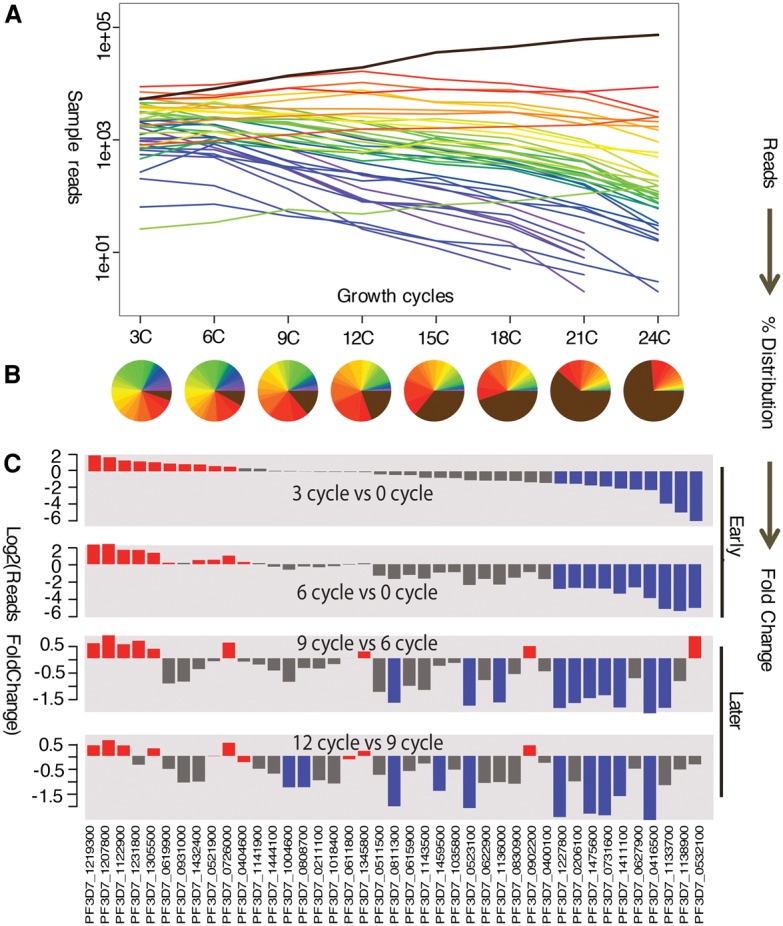
Figure 4.

Using QIseq to measure growth of 41 piggyBac mutants within a single pool. As described in the Methods, 41 individual piggyBac mutants were pooled and grown over 24 cycles, with the relative abundance of each clone measured by QIseq counts every three cycles. (A) Growth of each piggyBac mutant growth measured by QIseq reads. (B) Relative abundance of each piggyBac mutant during each measured growth cycle, represented by percentage of reads. (C) Identifying neutral or advantageous mutations and deleterious mutations within the pool. Bars represent fold change in read number for each mutant over time; the top quartile (N = 10) represents the neutral mutation phenotypes (red) and the bottom quartile represents the deleterious or ‘loser’ mutation phenotypes (blue) in competitive growth conditions.
