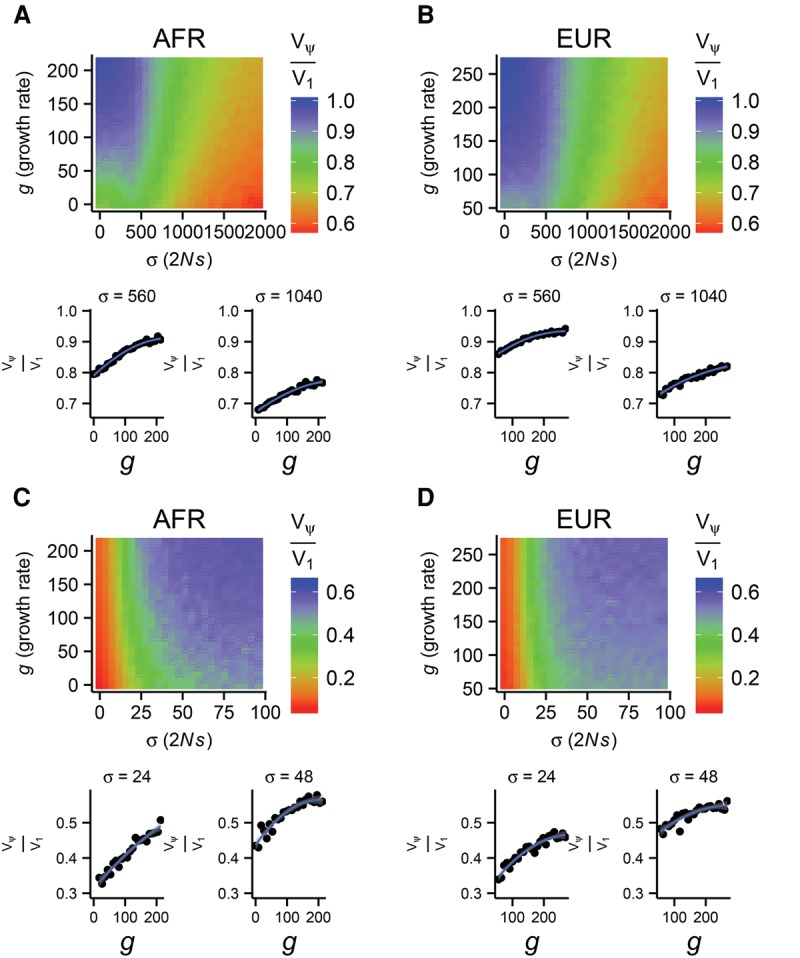
Figure 2.

The fraction of the genetic variance that is contributed by singletons, Vψ/V1, in a sample of n = 103 chromosomes as a function of growth rate (g) and standard deviation in selection strength (σ) in models of both African (A,C) and European (B,D) demographic history. The mean selection strength was fixed at 2Ns = −450 (A,B) and 2Ns = −8 (C,D), with ρ = 0.99 and τ = 1.0. The smaller panels plot two cross sections of each heat map to show changes in Vψ/V1.
