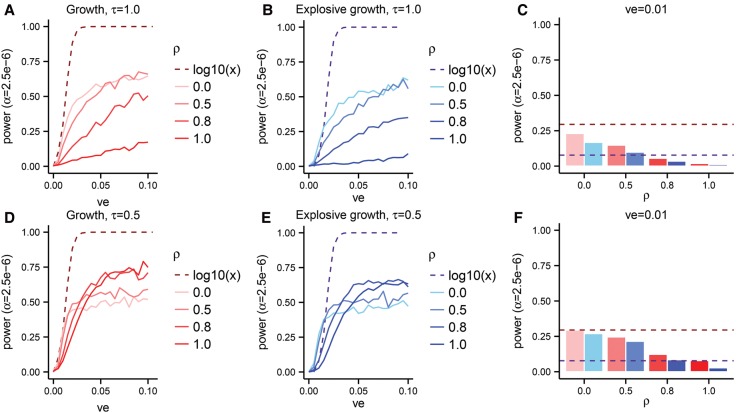
Figure 4.
The power of SKAT-O in Europeans as a function of the variance explained (ve) by a gene on a phenotype in a sample of size n = 104 chromosomes under various effect size models. The explosive growth model (B,E) of Tennessen et al. (2012) is shown in shades of blue, and the growth model (A,D) of Gravel et al. (2011) is shown in shades of red. The dashed lines show the power when the effect sizes are taken to be proportional to log10(x) for alleles at frequency x, whereas the solid lines (A,B,D,E) and bars (C,F) show results from our phenotype model. Panel C aggregates data from A and B for ve = 0.01, while panel F aggregates data from D and E for ve = 0.01.

