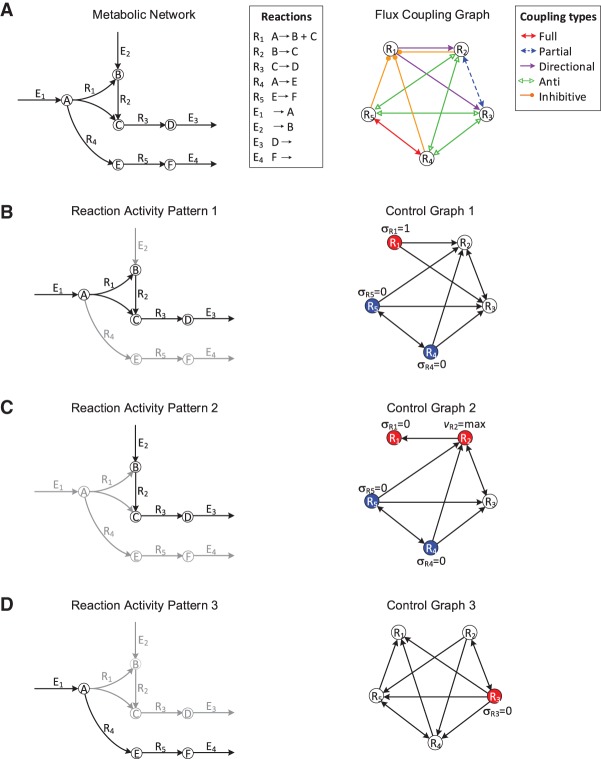
Figure 1.
Illustration of flux coupling graph, control graph, and driver reactions. (A, left) Metabolic network with vertices representing metabolites, labeled A–F; hyperedges representing internal reactions, labeled R1–R5; and exchange reactions, labeled E1–E4. (Right) Flux coupling graph of the internal reactions of the metabolic network, with vertices representing reactions and labeled edges representing the five coupling relations (represented by different colors; see legend). Here, only internal reactions are considered for brevity (Supplemental Fig. S1 shows the flux coupling graph including exchange reactions). (B–D) Three activity patterns (left) describing the active (black arrows) and inactive reactions (gray arrows). The control graphs (right) are obtained by integrating the flux coupling graph with the activity pattern and describe which reactions can be controlled to impose the status of other reactions in the activity pattern (Methods). The driver reactions are given by a smallest set of vertices, such that each vertex in the control graph is either contained in the set or a direct successor of a vertex from the set. Vertices corresponding to driver reactions are colored; one vertex of each color must be controlled simultaneously. The required activities of the driver reactions (deactivation, activation, or maximization) are depicted next to the vertices. For example, activity pattern 1 is achieved by the simultaneous activation of R1 and deactivation of either R4 or R5.

