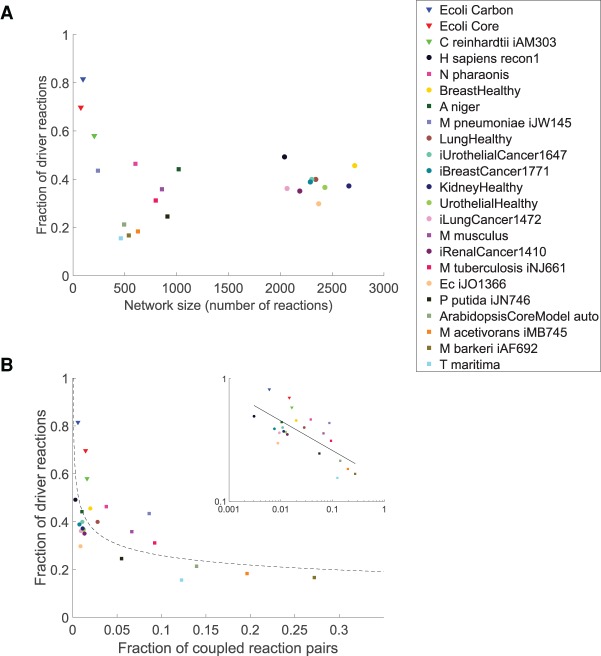
Figure 3.
Flux control properties of the 23 analyzed metabolic networks. (A) Relationship between network size (x-axis) and complexity of flux control, as quantified by the fraction of driver reactions required for controlling all reactions (y-axis). Three groups can be distinguished: small central metabolic networks containing large fractions of driver reactions (triangles); medium-sized, predominantly microbial networks (squares); and the large E. coli, human and cancer networks containing the smallest fractions of driver reactions (circles) (see also Supplemental Fig. S4). (B) Relationship between flux coupling frequency and the fraction of driver reactions. Networks are arranged by the fraction of coupled reaction pairs (x-axis) and fraction of driver reactions required for controlling all reactions (y-axis). The fraction of driver reactions decays logarithmically (scaling coefficient of 0.24, dashed line) with the fraction of coupled reactions, indicated by a Pearson correlation of −0.72 on the log-log data (inset). The legend is sorted by decreasing fraction of driver reactions required for control of the network.

