Figure 1.
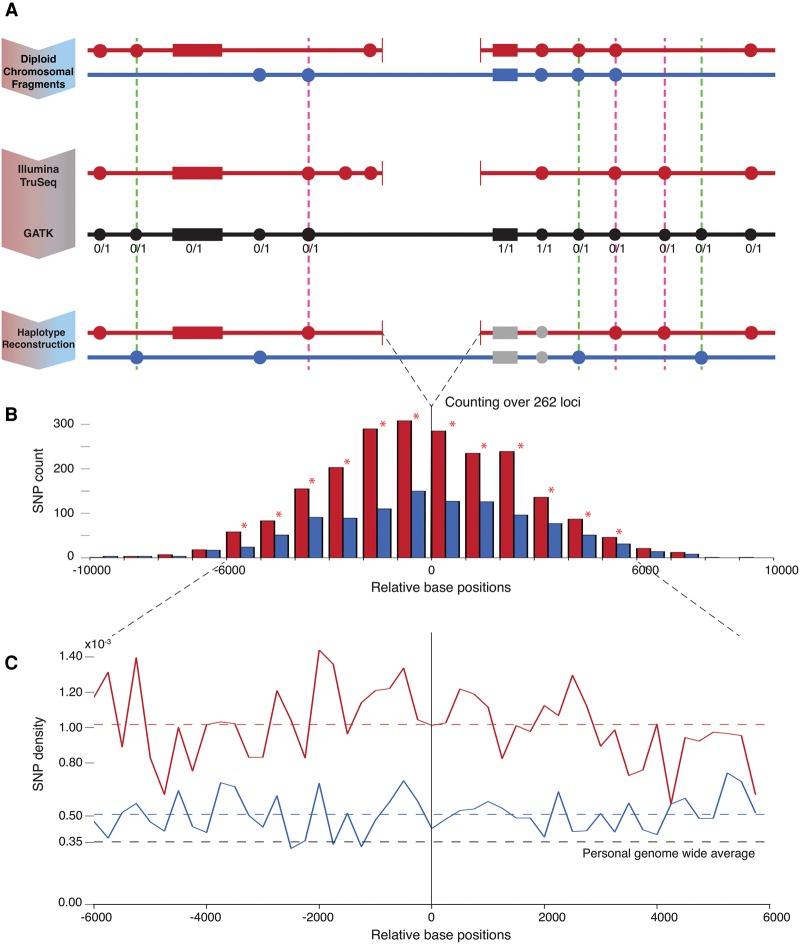
Schematic and results of the analysis. (A) Personal real haplotypes with deletion (red) and without deletion (pure blue) are shown along with flanking SNPs/indels depicted by filled circles/rectangles. TruSeq data allows resolving SNPs/indels on the haplotype with deletion (the set of in-phase variants). The GATK variant calls (black) include SNPs/indels for both haplotypes and also provide genotype information. The reconstructed haplotype without deletion (the set of out-of-phase variants) is obtained through complement of GATK to TruSeq calls. Only heterozygous SNPs/indels are further counted. The dashed pink/green lines highlight error cases that increase the count for the haplotype with/without deletion, respectively. The pink errors are highly unlikely (see text), and the green cases can only contribute against our result. (B) Histogram showing the count of heterozygous SNPs on both haplotypes with respect to distance from the deletions’ breakpoints. A total of 262 loci with heterozygous deletions are considered. Statistically significant differences (by Z-test) in SNP counts in bins marked by star are observed in 6-kbp flanking windows. (C) Densities of heterozygous SNPs on haplotypes with and without deletions are roughly constant and higher than personal genome-wide average per haplotype. The density with deletions is twice as high as without. In-phase indel density is 33% higher than out-of-phase (not shown in figure).

