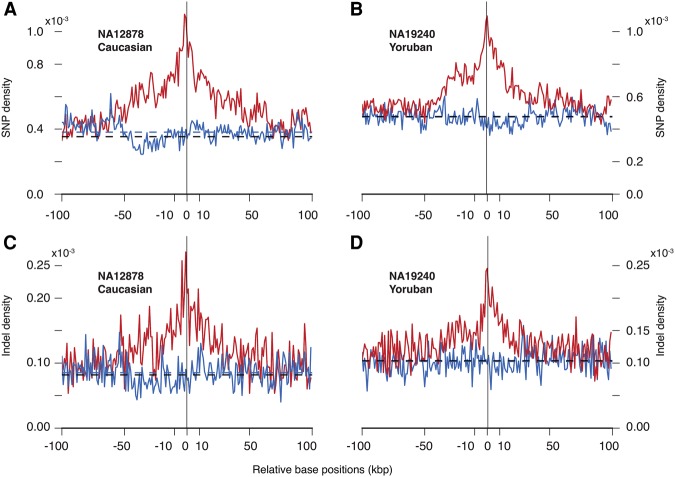
Figure 2.
Densities of in-phase (red) and out-of-phase (blue) heterozygous SNPs/indels flanking deletions in (A,C) Caucasian (NA12878) and (B,D) Yoruban (NA19240) individuals. Densities are obtained from trio-based haplotype reconstruction. Average out-of-phase densities for the displayed interval are shown by dashed lines (blue). Genome-wide average densities of heterozygous SNPs per haplotype are shown by black dashed lines. In the Yoruban trio, average out-of-phase and genome-wide densities are almost the same.

