Figure 4.
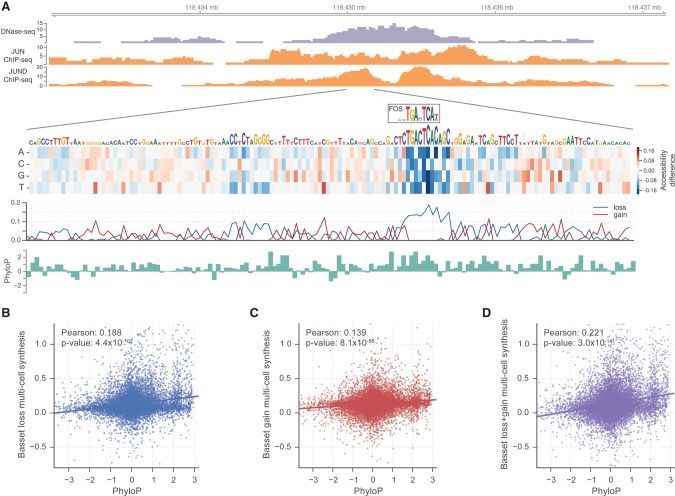
In silico saturated mutagenesis for DNase I hypersensitivity. (A) We used Basset to predict the effect of every mutation on the accessibility of the region Chr 9: 118,434,976–118,435,175 in H1-hESCs. The heat map displays the change in predicted accessibility for mutated sequences. Each column corresponds to a position in the sequence. Each row represents mutation to the corresponding nucleotide. In the line plot below, loss scores measure the maximum decrease among all mutations from the true nucleotide. Gain scores measure the maximum increase. We drew nucleotides to be proportional to the loss score, beyond a minimum height. At this locus, the model highlights the TGASTCA motif of the AP-1 complex (shown as the CIS-BP database motif for FOS). ChIP-seq of JUN and JUND in H1-hESCs confirm binding of the complex. The bound motif displays high conservation according to PhyloP. (B) Genome-wide, loss scores had a strong relationship with PhyloP (see Methods). (C,D) Gain scores alone had a weaker relationship (C), but the combination of gain and loss scores achieved the strongest relationship (D).

