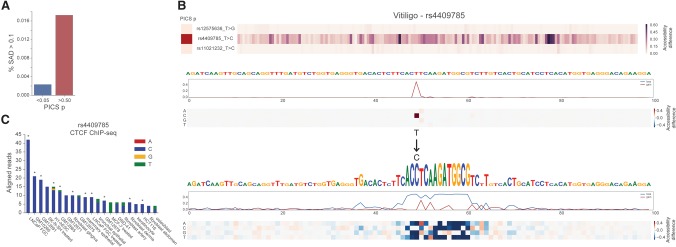
Figure 5.
SNP accessibility difference (SAD) scores enable genomic variant interpretation. (A) Basset assigned greater scores to likely causal GWAS SNPs (PICS probability >0.5) versus unlikely nearby SNPs (PICS probability <0.05) as determined by population fine mapping data. The bars measure the proportion of SNPs assigned a SAD profile mean across all cell types of more than 0.1. (B) We annotated rs4409785 among the highest SAD scores, in agreement with the PICS view of this haplotype block. Basset predicts the more common T allele to be completely dormant, but the region transforms with the C allele into a site deemed by Basset to have very high accessibility due to a CTCF binding site. (C) CTCF ChIP-seq in 88 unique cell types strongly supports the allele specificity of CTCF at this site. We plotted cells with more than three reads (summed across replicates) aligned to the site, and marked significant peak calls with asterisks. The 11 cells with significant peak calls all sequenced the C allele.

