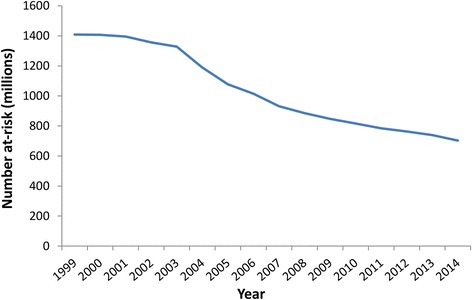
Fig. 4.

The estimated decline in the number of people at-risk of LF infection over time. The reductions were projected using the model presented in [18] and Fig. 3. Since a few countries are still doing mapping/have not started, the numbers at-risk remain incompletely defined. If a country has passed the Transmission Assessment Survey (TAS) in all of its implementation units it was assumed to have an at-risk population of zero (from that point forward)
