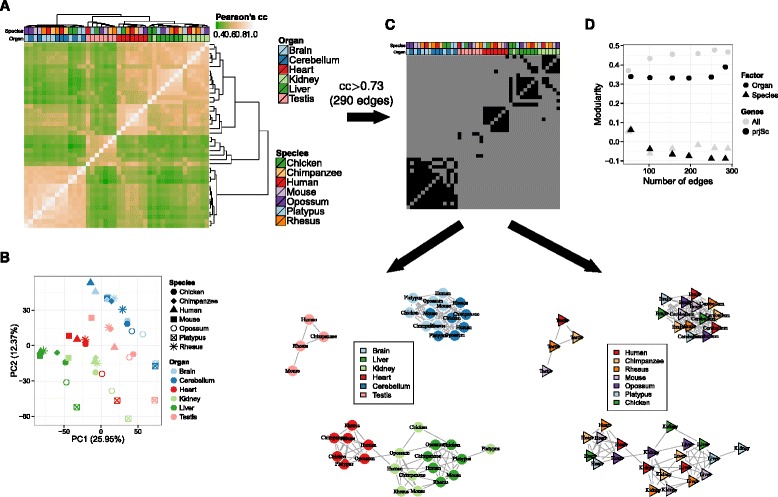
Fig. 1.

Hierarchical clustering (a) and PCA (b) based on the expression of 6283 orthologous genes in six organs from seven species show a predominant clustering of organs. Gene expression is computed as log10-normalized cRPKM, with a pseudocount of 0.01. Pearson’s correlation coefficient is computed for each pair of samples. The distance metric used for clustering is again Pearson’s correlation coefficient, and a complete linkage algorithm is applied to the Pearson’s correlation coefficients between each pair of samples. PCA was performed on the same log10-normalized cRPKM, after centering and scaling the expression of each gene across all samples. c Example of a network built from the pairwise correlation coefficients (top). In such a network (bottom), samples are nodes, and edges are drawn when two samples have a correlation coefficient higher than a given threshold (0.73 in the example, which gives 290 edges, as in the last point of d). Network nodes are colored either by organ (left) or species (right), which are the factors used to compute the modularity (see “Methods”). d Modularity analysis for the network of gene expression correlations made from six tissues and seven species. The modularity is given as a function of the number of edges in the network, when vertex type is organ (circle) or species (triangle), and when the genes considered are all genes (gray) or only the projection score genes (black). cc correlation coefficient, PC principal component, PCA principal component analysis, prjSc projection score
