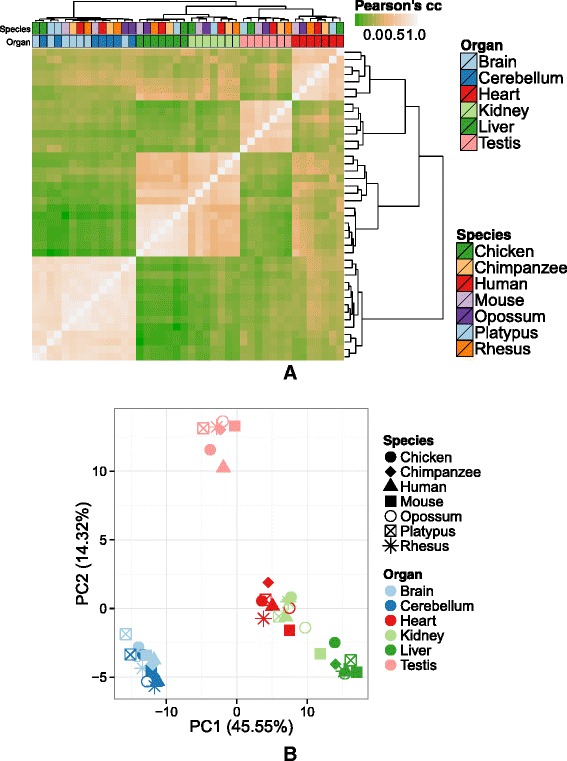
Fig. 2.

Hierarchical clustering (a) and PCA (b) based on the expression of 256 genes identified by the projection score [13] show a stronger organ-dominated clustering than when including all genes. Clustering and PCA were performed in the same way as in Fig. 1. cc correlation coefficient, PC principal component, PCA principal component analysis
