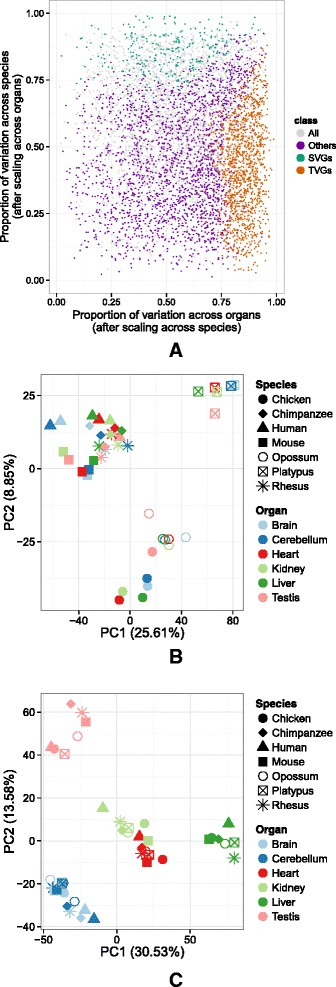
Fig. 5.

a Proportion of expression variance explained after centering and scaling each gene expression across species (x-axis) or across organs (y-axis) for the 6283 orthologous genes. When centering and scaling across species, the variance explained by species is 0 and there is only variance explained by organ (x-axis). Conversely, the y-axis is the proportion of variance explained by species after the variance across organs becomes 0 because of centering and scaling across organs. Dots are colored based on the class assigned to each gene. A PCA is performed on the gene expression of all 6283 orthologous genes after centering and scaling their expression across organs (b) or across species (c). The first PCA shows a species-dominated clustering, while the second one shows an organ-dominated clustering. PC principal component, PCA principal component analysis, SVG species-variable gene, TVG tissue-variable gene
