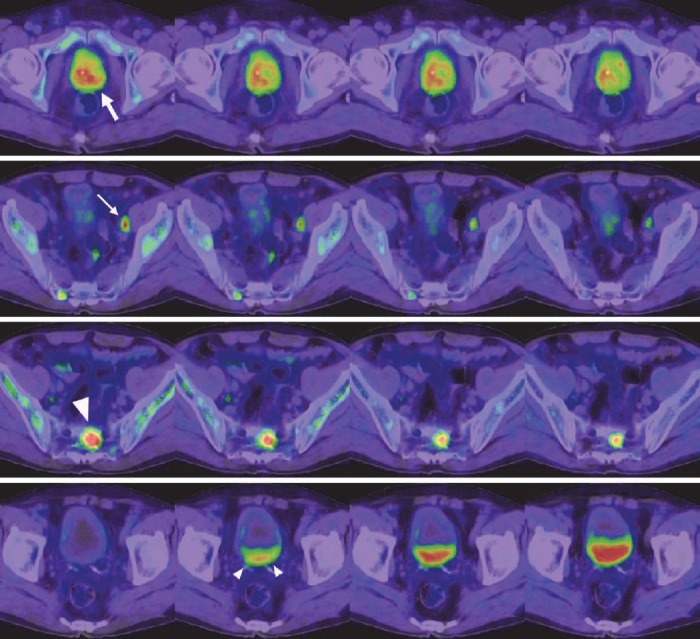
Figure 2.

Axial fusion images of anti-18F-FACBC PET/CT in a patient with lymph node and limited bone metastasis (patient no. 10 in Table 1). From left to right, 5 min, 15 min, 30 min, and 58 min images are presented. On the 5 min images, the primary site (thick arrow), significantly enlarged lymph node in the left external iliac region (thin arrow), and sacral bone lesion (large arrowhead) showed increased uptake. Activity decreased over time; however, it was still evident on the 58-min images. Urinary excretion in the bladder is noted on the 15 min image (small arrowheads), followed by a gradual increase
