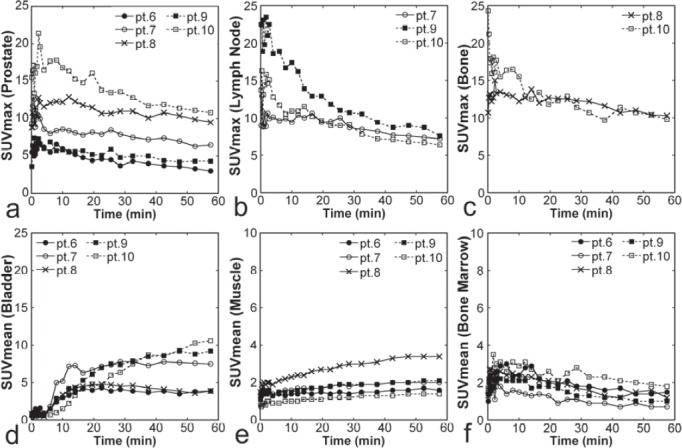
Figure 5.

Time courses of SUVs from dynamic Imaging. SUVmax for primary prostate lesions (a, n = 5), SUVmax for metastatic lymph nodes (b, n = 3), SUVmax for metastatic bone lesions (c, n = 2), SUVmean for the bladder (d, n = 5), SUVmean for the muscle (e, n = 5), SUVmean for the bone marrow (f, n = 5) are presented for each patient. The patient number (for example, pt. 6) corresponds to that in Table 1. Note that the scales of panels E and F are different from those of panels a-d
