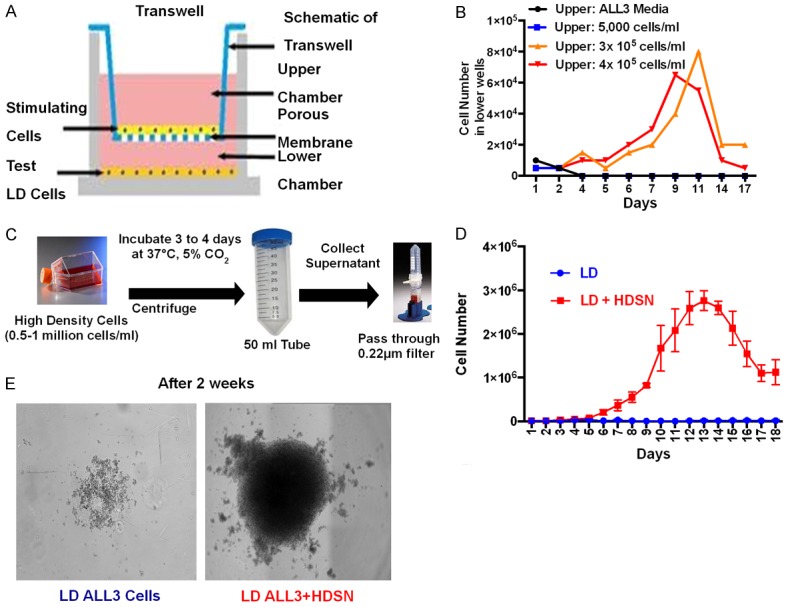
Figure 6.

Effect of HD ALL3 supernatants on growth of LD ALL3 cells. A. Schematics of transwell experiment. The upper insert can hold 1.5 ml and lower well can hold 2.6 ml. Upper insert and lower well are separated by a membrane with 0.4 μm pore size (growth area of insert is 44 cm2 for 100 mm dish in 75 mm transwell). Stimulating cells to be tested were kept in upper inserts and test cells in lower wells. B. Transwell experiments demonstrated stimulation of the LD ALL3 cells in the lower wells by HD ALL3 cells growing exponentially in the upper inserts. The graph shows total number of viable cells per ml in lower wells at different conditions as shown in legends. The ALL3 cells growing at HD of 3 × 10⁵-4 × 10⁵ cells/ml in the upper inserts stimulated the growth of the LD ALL3 cells at 5,000 cells/ml in lower wells shown as orange or red color lines, respectively. LD ALL3 cells in lower wells did not grow in the presence of either ALL3 media only or LD ALL3 cells (5,000 cells/ml) in the upper inserts shown as black and blue lines, respectively. The growth of the viable LD ALL3 cells in lower wells was determined using the trypan-blue exclusion assay method. C. Scheme showing collection of filtered HDSN. The HD ALL3 cells were grown at 0.5-1 million cells/ml in ALL3 media for 3 or 4 days. Then, the ALL3 cells were centrifuged and HDSN was filtered using 0.2 μm 50-ml Millipore tubes. Filtered HDSN was used for various assays. D. Comparative growth of the LD ALL3 cells in the presence (red line) and absence (blue line) of filtered HDSN. The growth was followed using the trypan blue exclusion method for 18 days. The y-axis represents the total number of viable cells per ml. E. Light microscopy images showing the lack of growth of the LD ALL3 cells in the absence (left panel) and presence of HDSN (right panel) after two weeks.
