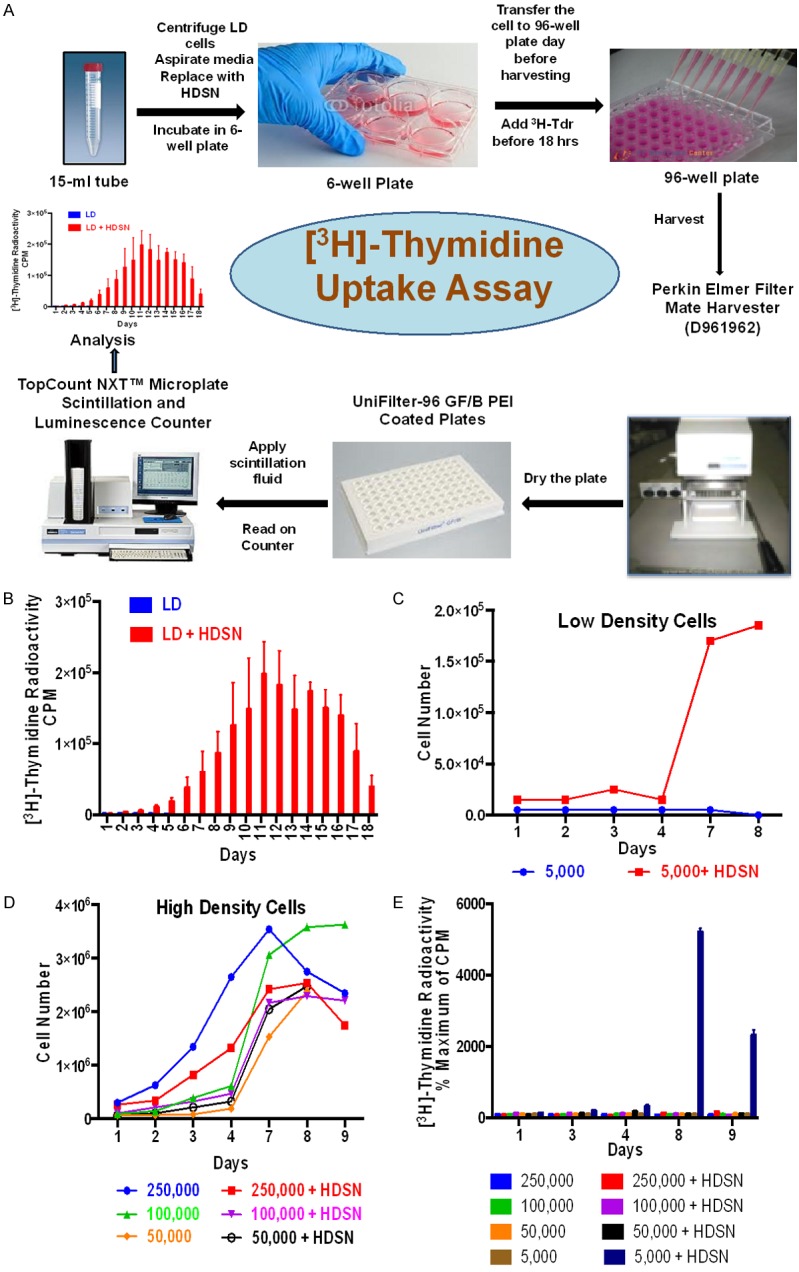
Figure 7.

Effect of supernates on the growth of LD and HD ALL3 cells using trypan-blue exclusion method and [3H]-thymidine uptake assay. (A) Scheme showing steps used for performing the [3H]-thymidine uptake assay. Refer to experimental method section for more detail. (B) The filtered HDSN were collected and mixed with LD ALL3 cells. Growth of the LD ALL3 cells in the presence or absence of HDSN was followed using the [3H]-thymidine uptake assay. The y-axis represents radioactive counts per minute (CPM). Blue bars represent LD ALL3 cells alone in media without HDSN and red bars represent LD ALL3 cells growing in HDSN. (C) Comparative growth of the LD ALL3 cells in absence (blue line) or presence (red line) of HDSN as followed using trypan blue exclusion. (D) Comparative stimulatory activity of the same HDSN used in (C) on the growth of HD ALL3 cells at starting cell densities of 2.5 × 10⁵, 105 and 0.5 × 10⁵ cells/ml followed using the trypan-blue exclusion method. The HDSN did not stimulate further growth of the ALL3 cells grown at HD at starting cell densities of 2.5 × 10⁵ (red line), 105 (pink line) or 0.5 × 10⁵ cells/ml (black line) and was moderately inhibitory. (E) The effect of the HDSN on the growth of HD and LD ALL3 cells using [3H]-thymidine uptake assay. The y-axis represents percentage CPM (% of maximum CPM) comparing stimulated and non-stimulated ALL3 cells on that particular day. As in (C) only the LD ALL3 cells at 5,000 cells/ml were stimulated by HDSN to grow.
