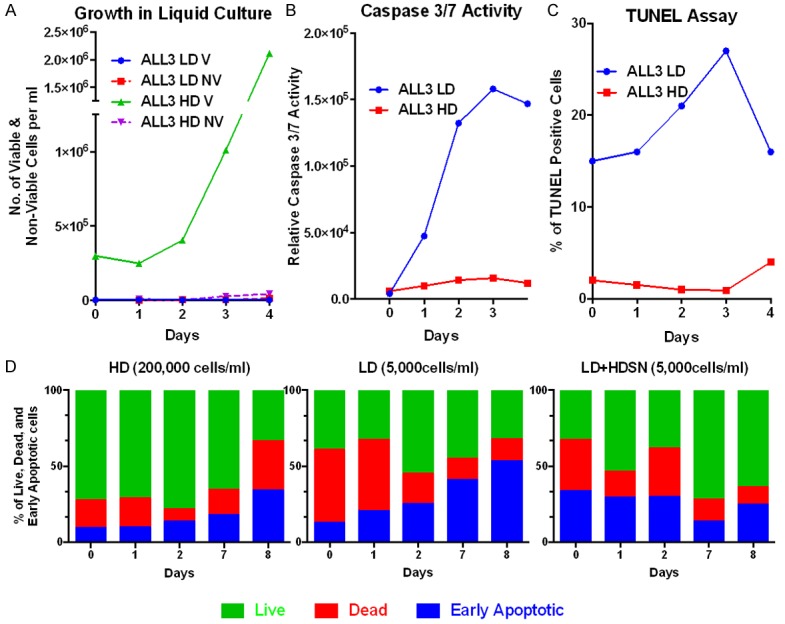
Figure 14.

Various apoptosis assays during growth of the HD ALL3 and no growth of the LD ALL3 cells in ALL3 media. A. Total number of viable and non-viable LD and HD ALL3 cells using the trypan blue exclusion method. B. Caspase 3/7 activity (Promega Technical Bulletins: Caspase Glo 3/7 assay, 2012) remained very low in rapidly proliferating cells starting at 3 × 10⁵ cells/ml, but rose rapidly in non-growing cells starting at 5000 cells/ml. C. Percent of TUNEL positive cells (Dead EndTM Fluorometric TUNEL System) remained very low in rapidly proliferating cells starting at 3 × 10⁵ cells/ml, but rose rapidly in non-growing cells starting at 5000 cells/ml. D. Daily flow cytometric AnnexinV-FITC/PI assay was conducted for the HD and LD ALL3 cells stained with Propidium iodide (PI) and AnnexinV-FITC. The HD ALL3 cells showed a rapid increase in early and late apoptosis as they approached saturation density on Day 8. The poorly growing LD cells alone without HDSN had an early increase in dead cells and progressive increase in early apoptotic cells with annexin and PI staining. Even though the LD ALL3 cells plus HDSN were immediately stimulated to grow rapidly with a DTs of 26 hr during the first 3 days, the majority of the LD+HDSN cells were estimated by FACS to still be in the early or late stages of apoptosis and by day 2 only about ~20% of the cells were alive. However, by days 7 and 8 the surviving cells had recovered and about 60-70% were ascertained to be live by FACS and the cells continued to grow well with a DTs of 35 hr. The Bar graphs represent the percent of total cells in each of the below defined gating categories. Green bar represents live cells (AnnexinV-FITC Neg/PI Neg), red bar represents dead cell population (AnnexinV-FITC Neg/PI Pos), and blue bar represents early apoptotic cell populations (AnnexinV-FITC Pos/PI Neg).
