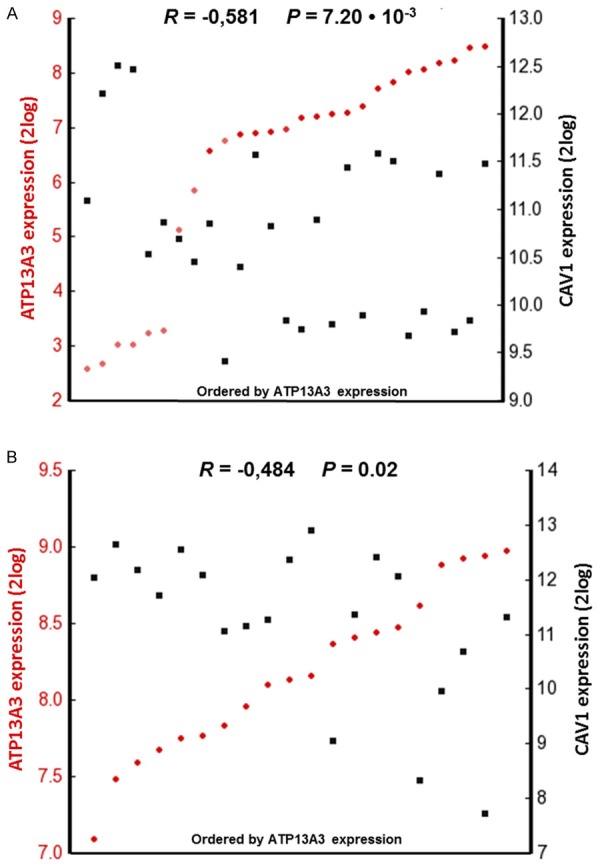
Figure 8.

Inverse ATP13A3 versus CAV1 mRNA expression in two pancreatic cell line sets. Visual representation of ATP13A3 and CAV1 mRNA expression correlations calculated over (A) 27 pancreas cell lines in the GSK-950 dataset and (B) 20 pancreatic cancer cell lines in the Sadanandam-47 dataset as analyzed using R2. The tumors are ranked horizontally from left to right according to their ATP13A3 mRNA expression as determined by Affymetrix array analyses (2log values). ATP13A3 and CAV1 expression values for each cell line are visualized with red circles and black rectangles, respectively. Dark and light colors denote samples with significant (“present call”), and absent expression, respectively. The correlations between ATP13A3 and CAV1 mRNA expression were inverse and statistically significant (calculated with a 2log Pearson test, see Materials and Methods).
