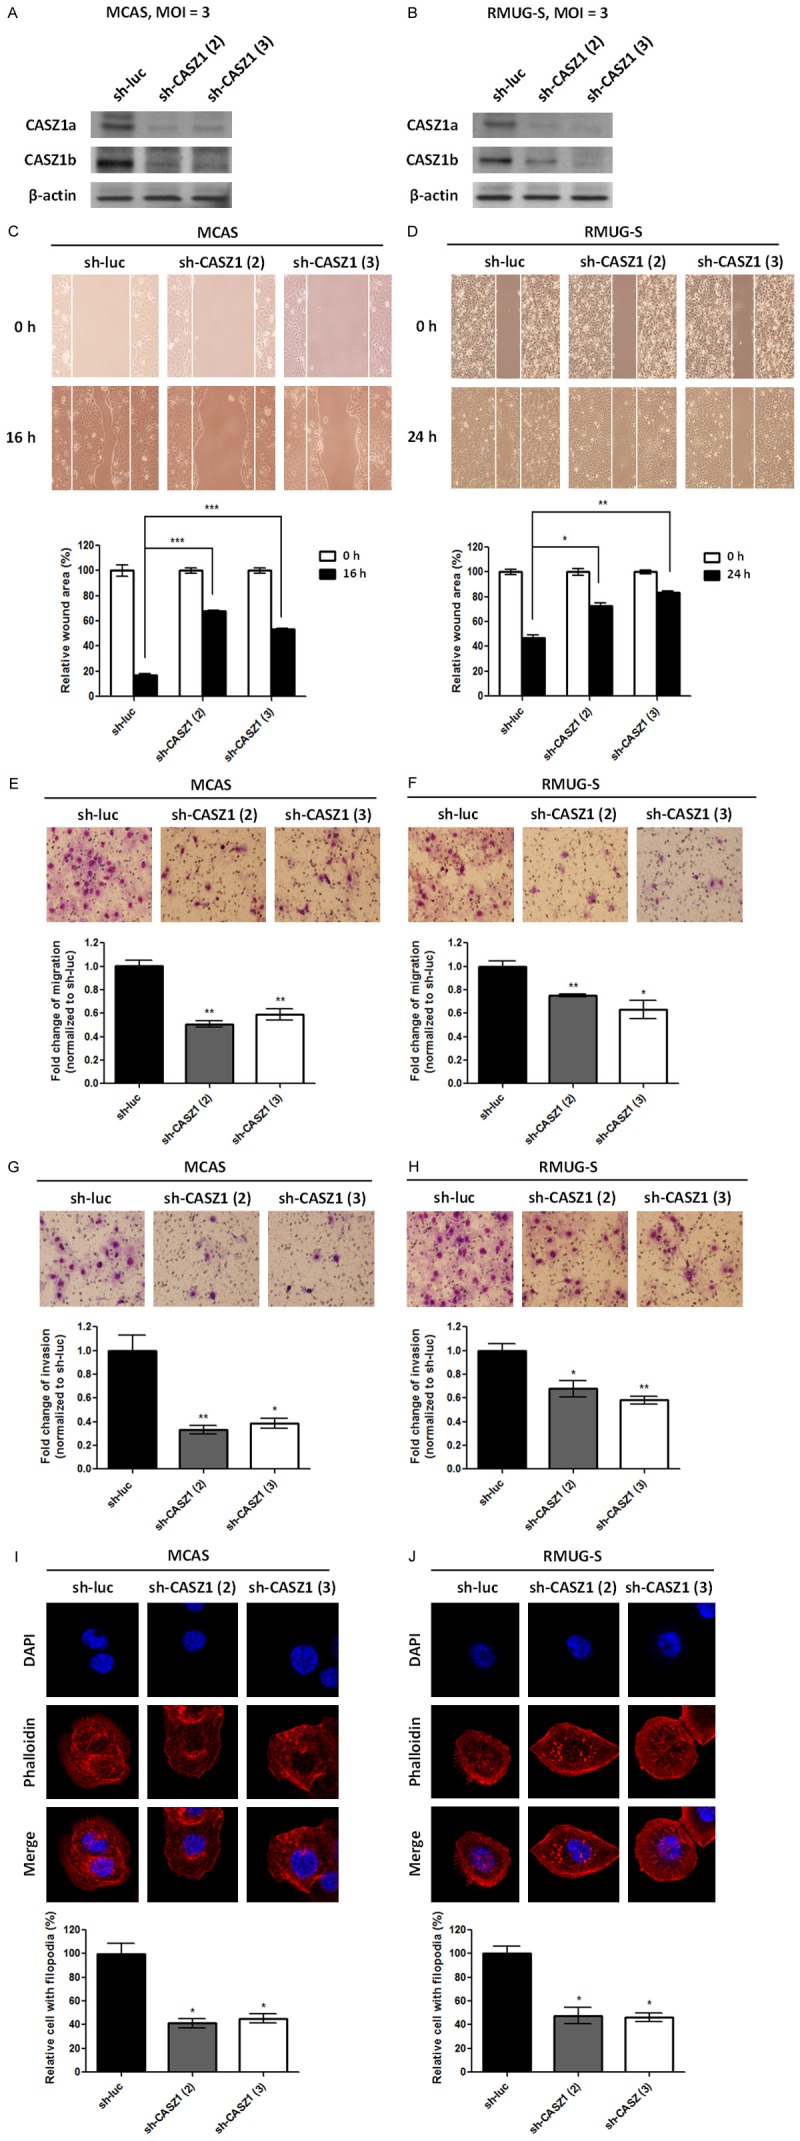
Figure 2.

CASZ1 knockdown suppresses migration and invasion in EOC cell lines. MCAS (A, C, E, G, I) and RMUG-S (B, D, F, H, J) cells were infected with the control shRNA (sh-luc) lentivirus or 2 different sh-CASZ1 lentiviruses, and stable clones were selected using puromycin. (A, B) The expression of CASZ1a and CASZ1b in the stable clones was analyzed using immunoblotting assays. β-actin was used as the internal control. The effect of sh-CASZ1 on tumor cell migration was determined using the wound healing assay (C, D) and the transwell migration assay (E, F). For the wound healing assay, 2 × 10⁴ cells expressing sh-luc, sh-CASZ1 (2), or sh-CASZ1 (3) were seeded on ibidi culture inserts. The wound area at 0 h and 16 or 24 h after the removal of culture inserts was measured using ImageJ (n ≥ 3 per group). The wound area at 16 or 24 h was normalized to the wound area measured at 0 h. For the transwell migration assay, 1 × 10⁵ cells expressing sh-luc, sh-CASZ1 (2), or sh-CASZ1 (3) were seeded on the transwells and incubated for 14 h. The cells that had migrated through the transwell were counted (n = 3 per group), and the values were normalized to the sh-luc group to calculate relative migration ability. (G, H) The effect of sh-CASZ1 on tumor cell invasion was determined using the in vitro transwell invasion assay. Briefly, 5 × 10⁵ cells expressing sh-luc, sh-CASZ1 (2), or sh-CASZ1 (3) were seeded on transwells coated with 100 μg of Matrigel and incubated for 24 h. The cells that had invaded the membrane were counted (n = 3 per group), and the values were normalized to the sh-luc group to calculate relative invasive ability. (I, J) CASZ1 knockdown inhibits filopodium formation in EOC cells. Cells were stained with rhodamine phalloidin to visualize F-actin, and the stained cells were observed using confocal microscopy. The number of filopodia-positive cells among a total of 250 cells was counted. The data were normalized to the sh-luc group to calculate the relative number of cells with filopodia. The data represent 3 independent experiments. The error bars represent the SEM. *P < 0.05; **P < 0.005; ***P < 0.001 by Student’s t-test.
