Figure 2.

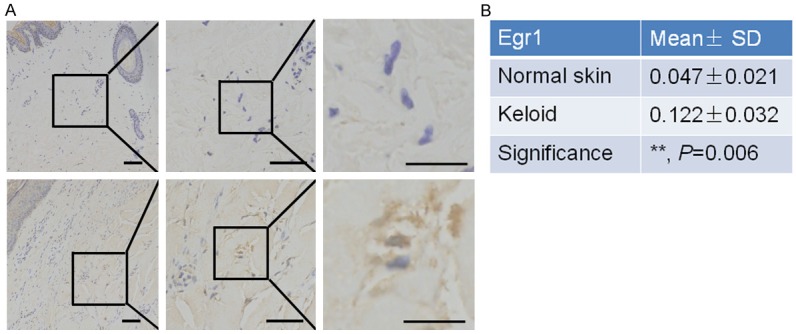
Overexpression of Egr1 protein in KFs of keloid tissues. A. Immunohistochemical analysis of Egr1 protein in keloid and paired normal skin tissues. Upper, K; lower, NS. Magnification: ×40 (left), ×200 (middle), and ×400 (right). B. Summarized data of immunostaining intensity of Egr1 protein between keloid and normal skin tissues. **P = 0.006.
