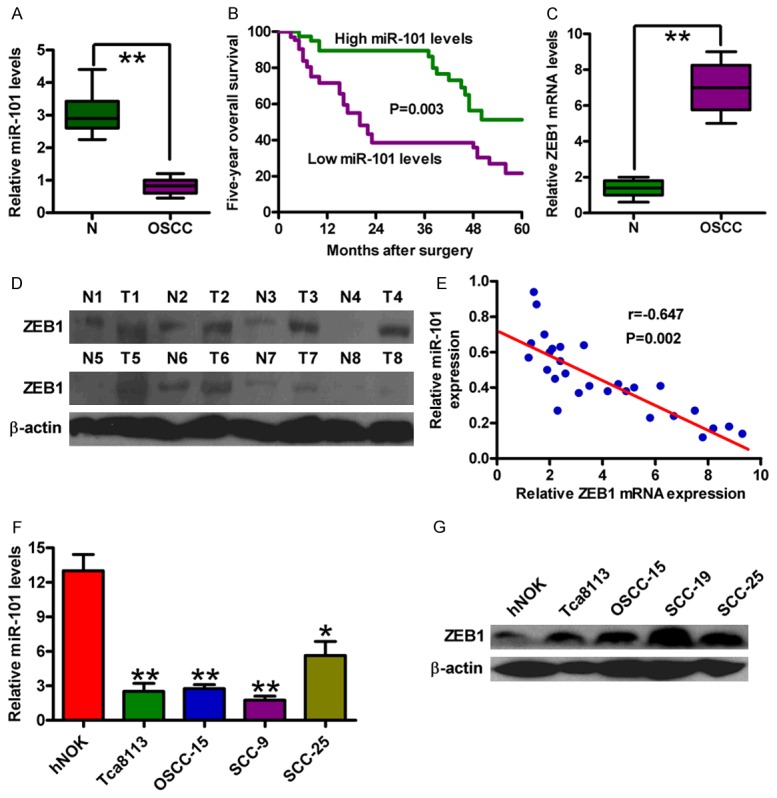
Figure 1.

Expression levels of miR-101 and ZEB1 in OSCC tissues and cell lines. (A) qPCR analysis of miR-101 levels in OSCC specimens and the adjacent non-cancerous specimens (n = 30). U6 was used as the endogenous control. (B) Kaplan-Meier survival curves of 40 patients with OSCCs divided by miR-101 expression. Log-rank test was used for survival analysis. qPCR (C) and Western blot (D) analyses of the mRNA and protein levels of ZEB1 in OSCC specimens and the adjacent non-cancerous specimens. GAPDH and β-actin were used as the internal controls, respectively. (E) Spearman’s correlation analysis between miR-101 and ZEB1 in OSCC specimens analyzed by qPCR assay. qPCR (F) and Western blot (G) assays were performed to assess miR-101 expression in four OSCC cell lines (Tca8113, OSCC-15, SCC-9 and SCC-25) and the hNOKs. U6 and β-actin were used as the endogenous controls. All data are shown as mean ± SD of three separate experiments. *P < 0.05; **P < 0.01.
