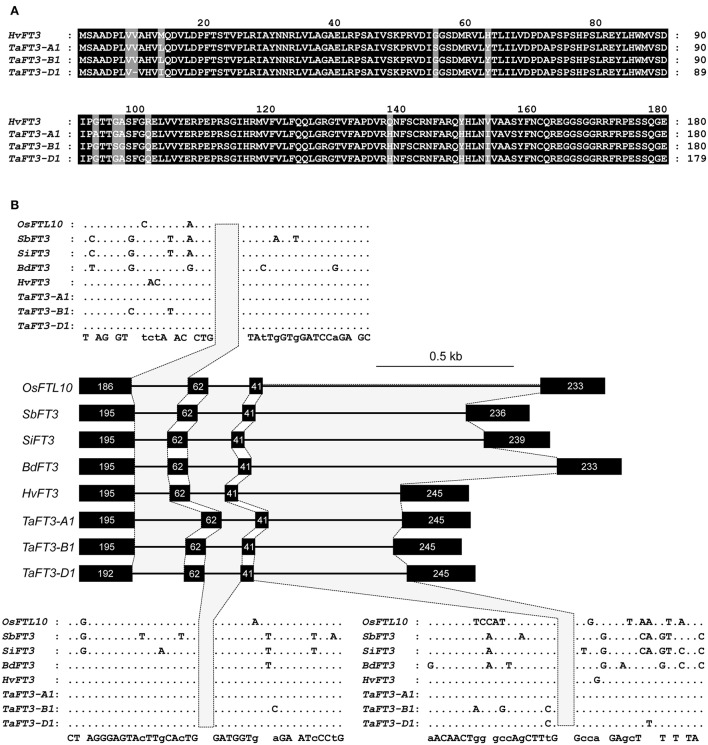
Figure 1.
Cross-species comparison of FT3 proteins and gene structure. (A) Alignment of predicted FT3 proteins from wheat (UniProtKB accessions W4ZP37, W5AOP4, W5AIL5) and barley (GenBank accession ADW83188). (B) Intron/exon structure of FT3 genes from six Poaceae species. Nucleotide number per exon is indicated within each exon. SbFT3 was not included, as compared to all other FT genes, the gene model is truncated at the 5′ end.

