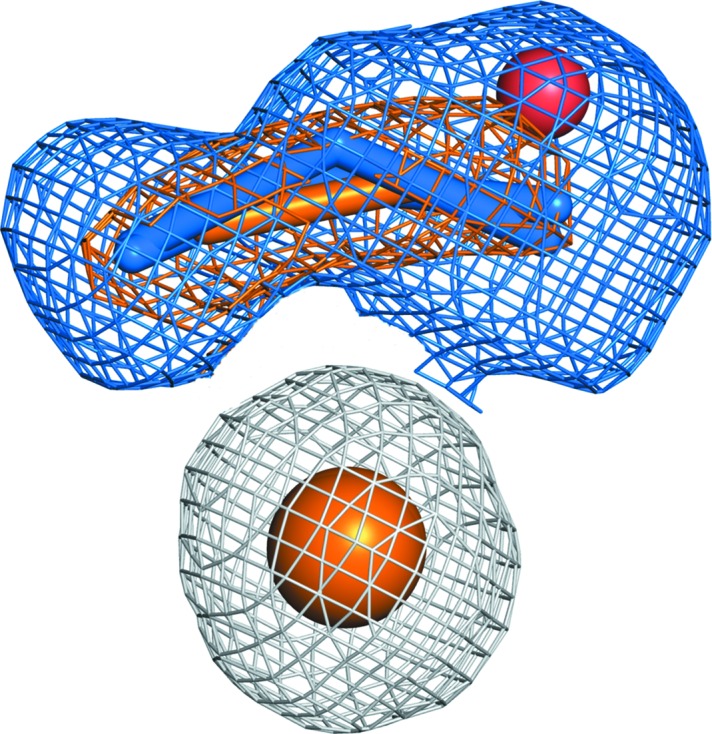
Figure 2.

The T2Cu site of ds1 with ‘top-hat’ and ‘side-on’ nitrite orientations (blue sticks) modelled in the 2F o − F c electron-density map (blue mesh) at 1.07 Å resolution, superimposed against the electron density corresponding to a ‘side-on’ nitric oxide product in ds17 (orange sticks and mesh) at 1.22 Å resolution. Both maps are contoured at 1σ.
