FIGURE 3.
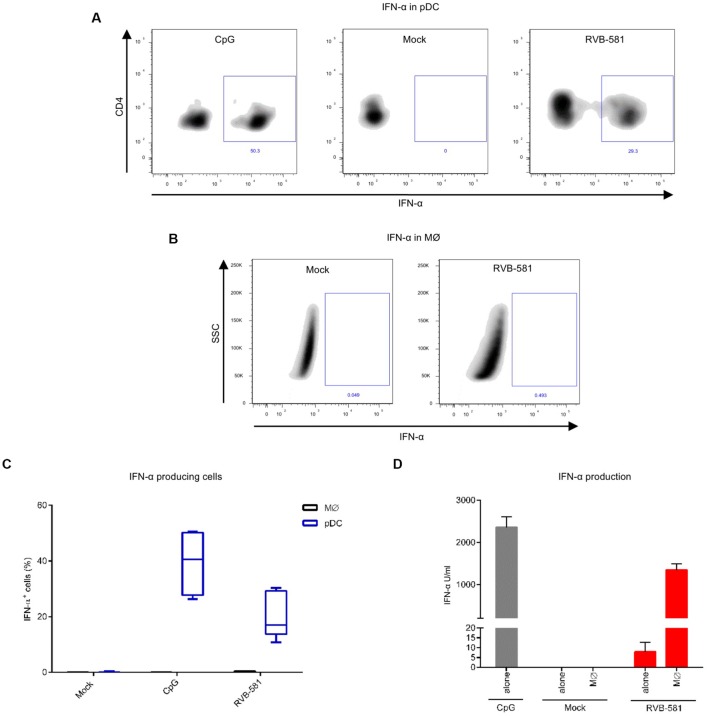
IFN-α production is restricted to pDC during co-culture with PRRSV-infected MØ. MØ were infected with PRRSV RVB-581 for 90 min, washed and then co-cultured with enriched pDC. Mock-treated MØ and CpG D32 stimulation were included as negative and positive controls, respectively. (A) Intracellular IFN-α staining of pDC (gated as CD172alowCD4+ cells) after CpG stimulation or co-culture with PRRSV-infected MØ. (B) Intracellular IFN-α staining of MØ (CD172a+CD4- cells), harvested from the same co-culture as in (A). (C) Boxplots made from nine replicates collected from three independent experiments showing the percentage of IFN-α expressing cells after stimulation as described in (A,B). (D) IFN-α levels in supernatants collected from the experiments shown in (A–C).

