
Figure 1. Design and characterization of dBET1.
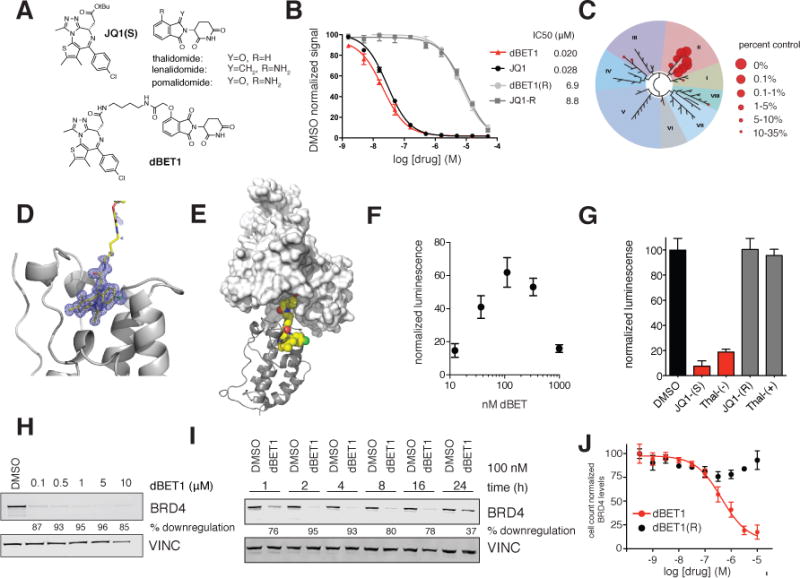
(A) Chemical structure of JQ1(S), the phthalimides and dBET1 (B) DMSO normalized BRD4 binding signal measured by AlphaScreen for the indicated compounds. Values represent mean ± stdev of triplicate analysis (C) Selectivity of dBET1 for binding to BETs over other human bromodomains, as determined by single point screening (BromoScan) (D) Crystal structure of dBET1 bound to bromodomain 1 of BRD4 (E) Docking of (D) into the published DDB1-CRBN structure (F) dimerization assay measuring dBET1 induced proximity between recombinant BRD4 bromodomain (1) and recombinant CRBN-DDB1. Values represent mean ± stdev of quadruplicate analysis and are normalized to DMSO. (G) competition of dBET1 induced proximity at 111 nM as shown in (F) in the presence of DMSO (vehicle), JQ1(S), thal-(−), JQ1(R) and thal-(+) all at a final concentration of 1 μM. Values represent mean ± stdev of quadruplicate analysis and are normalized to DMSO. (H) Immunoblot analysis for BRD4 and Vinculin after 18 h treatment of MV4;11 cells with the indicated concentrations of dBET1 (I) Immunoblot analysis for BRD4 and Vinculin after treatment of MV4;11 cells with 100 nM dBET1 at the indicated timepoints (J) Cell count normalized BRD4 levels as determined by high-content assay in SUM149 cells treated with the indicated concentrations of dBET1 and dBET1(R) for 18 h. Values represent mean ± stdev of triplicate analysis, are normalized to DMSO treated cells and baseline corrected based on immunoblots in Supplementary Figure 2C