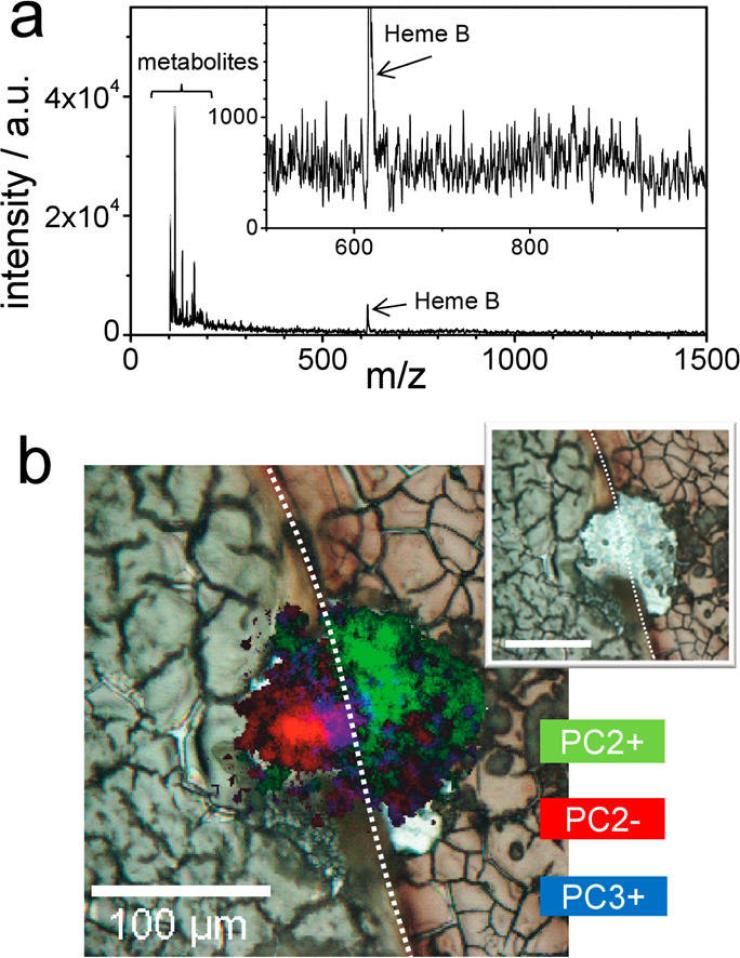
Figure 4.
Microscope mode IR MALDI MSI of a bait fish cryo-section showing (a) IR MALDI integrated mass spectrum obtained without external matrix using all detector pixels and 2000 laser shots and (b) an overlay of an optical microscopy image of the sample and mass spectrometry images of several phosphatidylcholines [37]. The white dotted lines depict the boundary between the liver (left) and stomach (right).

