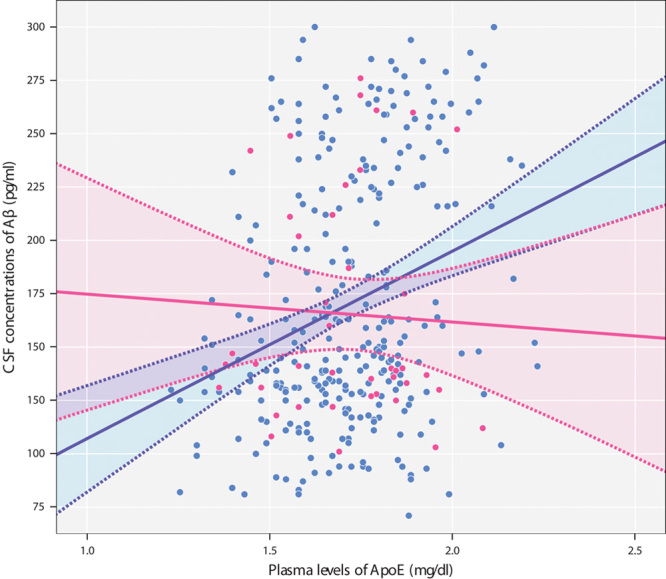
Fig. 1.

Higher plasma ApoE levels are associated with increased CSF Aβ1–42 concentrations in C-allele carriers (blue), but not in T-homozygotes (pink). x-axis: plasma ApoE levels; y-axis: CSF levels of Aβ1–42. Each dot represents a single patient's plasma and CSF concentrations of these biomarkers. Solid lines indicate regression lines. Dotted lines represent 95% confidence intervals for the mean. Aβ1–42, amyloid-β1–42; ApoE, apolipoprotein E; CSF, cerebrospinal fluid.
