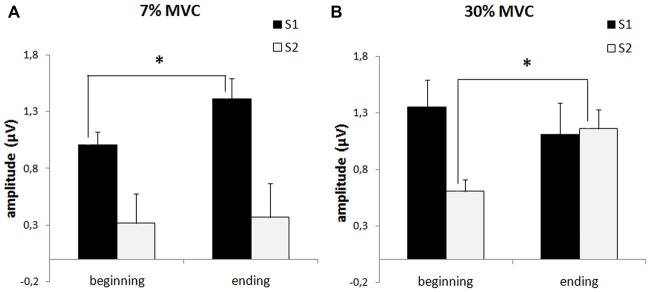
Figure 4.
P50 amplitude in response to the first stimulus (AS1, black columns) and to the second stimulus (AS2, white columns) during fatigue development (“beginning” and “ending”) in the 2nd (7% MVC) block (A) and the 3rd (30% MVC) block (B). The bars indicated the standard error. Stars denote significant differences (p < 0.05).

