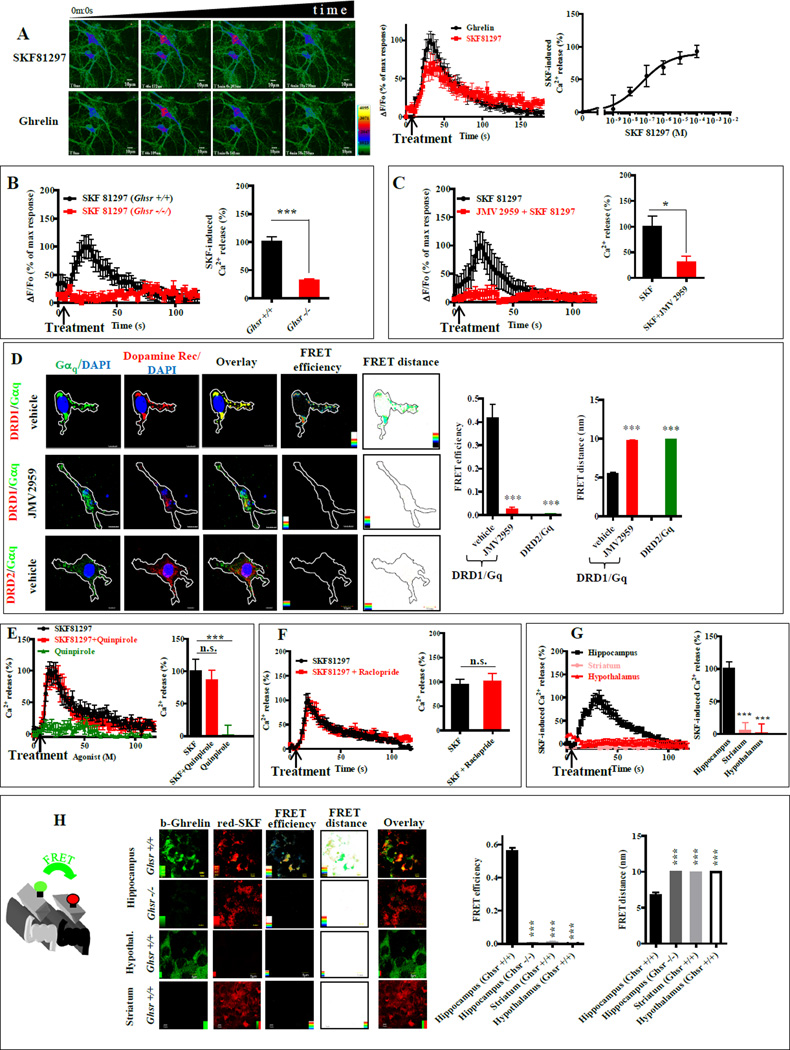
Figure 2. In hippocampal neurons, DRD1 agonist-induced [Ca2+]i mobilization is dependent on GHSR1a, but not on DRD2.
(A) SKF81297 (10 µM, upper row) produced a transient Ca2+ response in hippocampal neurons; after removing SKF81297 the same cells responded to ghrelin (100 nM, lower row). SKF81297 induced dose-dependent [Ca2+]i release (right). Scale bar, 10 µm.
(B) SKF81297-induced [Ca2+]i mobilization in hippocampal organotypic slices from Ghsr+/+ and Ghsr −/− mice (left).
(C) JMV2959 (10 µM) inhibits SKF81297 (10 µM) induced [Ca2+]i mobilization in hippocampal organotypic slices.
(D) Hippocampal neurons treated with vehicle (upper) or JMV2959 (middle); Gαq (green) and DRD1 (red) images analyzed by FRET microscopy. Lower row: DRD2 (red), Gαq (green) quantitative analysis of FRET efficiency and FRET distance (right). Scale bar, 10 µm.
(E and F) [Ca2+]i mobilization in hippocampal organotypic slices in the presence of SKF81297 (10µM), SKF81297 (10µM) + Quinpirole (10µM) and Quinpirole (10µM) (E); or SKF81297 (10µM) and SKF81297 (10µM) + Raclopride (10µM) (F).
(G) SKF81297-induced (10 µM) [Ca2+]i mobilization in neurons from hippocampus, hypothalamus and striatum (left).
(H) FRET confocal microscopy images on organotypic brain slices from hippocampus, hypothalamus and striatum of Ghsr+/+ mice; slices from Ghsr−/− as control. GHSR1a (green), DRD1 (red); Scale bar, 5 µm.
Data represent the mean ± SEM of at least three independent experiments in duplicate (*, p<0.05 versus control; ***, p<0.001 versus control).

