Figure 4.
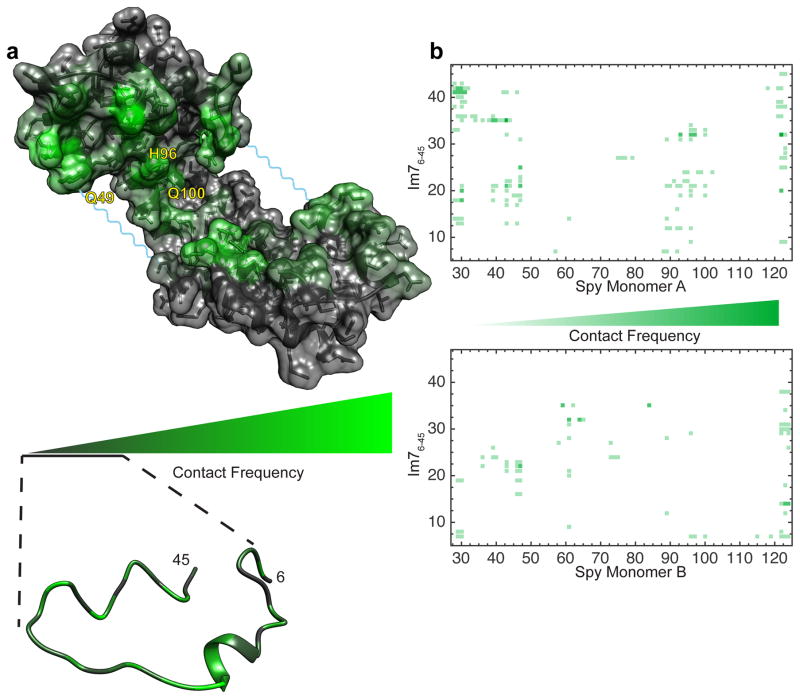
Contact maps of Spy:Im76-45 complex. (a) Spy:Im76-45 contact map projected onto the bound Spy dimer (above) and Im76-45 (below) structures. For clarity, Im76-45 is represented with a single conformation. The frequency plotted is calculated as the average contact frequency from Spy to every residue of Im76-45 and vice-versa. As the residues involved in contacts are more evenly distributed in Im76-45 compared to Spy, its contact map was amplified. (b) Detailed contact maps of Spy:Im76-45. Contacts to the two Spy monomers are depicted separately. Note that the flexible linker region of Spy (residues 47–57) is not represented in the 2D contact maps.

