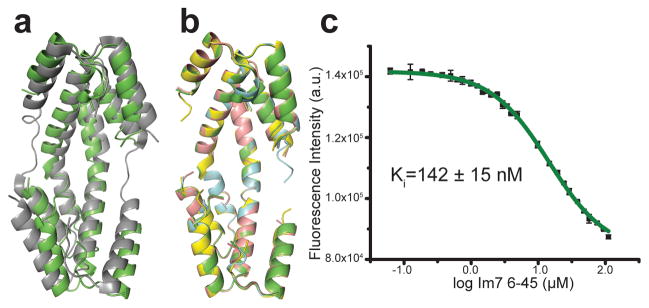
Figure 5.
Spy conformation changes upon substrate binding. (a) Overlay of apo Spy (PDB ID: 3O39, gray) and bound Spy (green). (b) Overlay of WT Spy bound to Im76-45 (green), H96L Spy bound to Im7 L18A L19 AL13A (blue), H96L Spy bound to WT Im7 (yellow), and WT Spy bound to casein (salmon). (c) Competition assay showing Im76-45 competes with Im7 L18A L19A L37A H40W for the same binding site on Spy (further substrate competition assays are shown in Supplementary Fig. 8). Error bars depict standard deviations of n=3 technical replicates.

